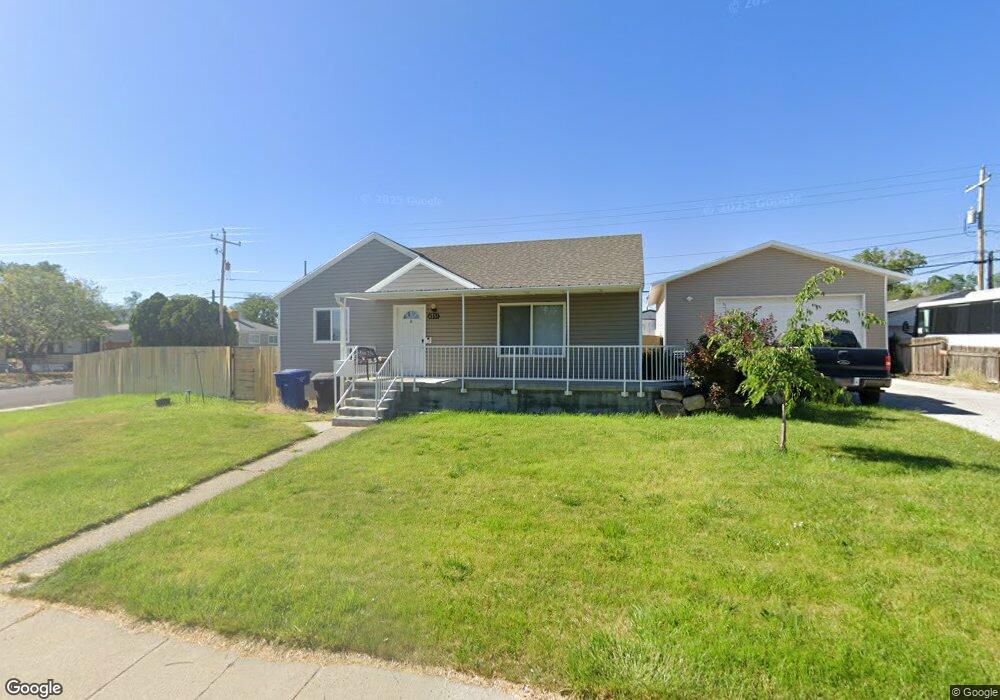
4331 W 5460 S Salt Lake City, UT 84118
Estimated Value: $397,000 - $436,502
3
Beds
1
Bath
1,080
Sq Ft
$378/Sq Ft
Est. Value
About This Home
This home is located at 4331 W 5460 S, Salt Lake City, UT 84118 and is currently estimated at $407,876, approximately $377 per square foot. 4331 W 5460 S is a home located in Salt Lake County with nearby schools including South Kearns Elementary School, Kearns Jr High School, and Kearns High School.
Ownership History
Date
Name
Owned For
Owner Type
Purchase Details
Closed on
Mar 2, 2012
Sold by
Bank Of New York Mallan Trust Co
Bought by
Johnson Kristie
Current Estimated Value
Purchase Details
Closed on
Jan 30, 1998
Sold by
Witkamp Garret and Witkamp Garet
Bought by
Witkamp Garret and Witkamp Misty G
Home Financials for this Owner
Home Financials are based on the most recent Mortgage that was taken out on this home.
Original Mortgage
$61,200
Interest Rate
6.52%
Mortgage Type
FHA
Create a Home Valuation Report for This Property
The Home Valuation Report is an in-depth analysis detailing your home's value as well as a comparison with similar homes in the area
Home Values in the Area
Average Home Value in this Area
Purchase History
| Date | Buyer | Sale Price | Title Company |
|---|---|---|---|
| Johnson Kristie | -- | Premier Title Insurance Agen | |
| Witkamp Garret | -- | -- |
Source: Public Records
Mortgage History
| Date | Status | Borrower | Loan Amount |
|---|---|---|---|
| Previous Owner | Witkamp Garret | $61,200 |
Source: Public Records
Tax History Compared to Growth
Tax History
| Year | Tax Paid | Tax Assessment Tax Assessment Total Assessment is a certain percentage of the fair market value that is determined by local assessors to be the total taxable value of land and additions on the property. | Land | Improvement |
|---|---|---|---|---|
| 2025 | $2,781 | $392,900 | $107,200 | $285,700 |
| 2024 | $2,781 | $374,500 | $100,700 | $273,800 |
| 2023 | $2,588 | $334,700 | $96,800 | $237,900 |
| 2022 | $2,752 | $350,700 | $95,000 | $255,700 |
| 2021 | $2,422 | $291,200 | $73,100 | $218,100 |
| 2020 | $2,192 | $240,000 | $66,600 | $173,400 |
| 2019 | $2,137 | $237,600 | $62,800 | $174,800 |
| 2018 | $2,046 | $219,500 | $62,800 | $156,700 |
| 2017 | $1,742 | $191,100 | $62,800 | $128,300 |
| 2016 | $1,645 | $162,100 | $57,900 | $104,200 |
| 2015 | $1,785 | $165,400 | $70,600 | $94,800 |
| 2014 | $1,482 | $151,800 | $65,500 | $86,300 |
Source: Public Records
Map
Nearby Homes