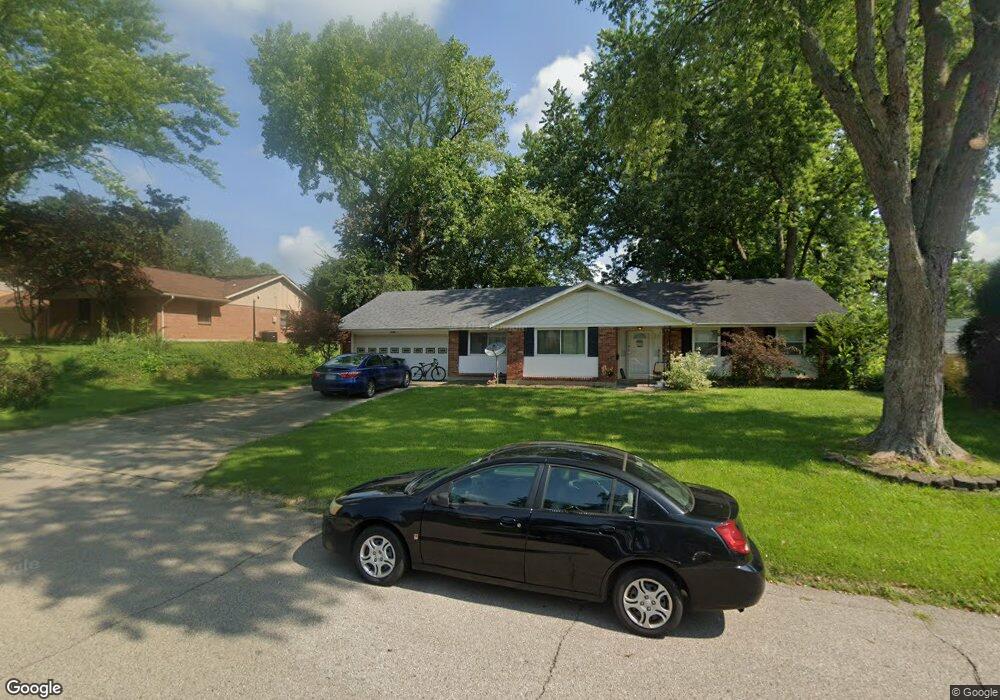
4332 Appleton Place Dayton, OH 45440
Estimated Value: $294,503 - $320,000
3
Beds
2
Baths
1,800
Sq Ft
$169/Sq Ft
Est. Value
About This Home
This home is located at 4332 Appleton Place, Dayton, OH 45440 and is currently estimated at $303,876, approximately $168 per square foot. 4332 Appleton Place is a home located in Montgomery County with nearby schools including Prass Elementary School, Kettering Middle School, and Kettering Fairmont High School.
Ownership History
Date
Name
Owned For
Owner Type
Purchase Details
Closed on
Sep 12, 2013
Sold by
Jessop Stephen M
Bought by
Ligotino John M and Ligotino Courtney M
Current Estimated Value
Home Financials for this Owner
Home Financials are based on the most recent Mortgage that was taken out on this home.
Original Mortgage
$139,850
Interest Rate
4.39%
Mortgage Type
VA
Purchase Details
Closed on
May 31, 2005
Sold by
Gschwender Joseph J and Gschwender Deborah
Bought by
Jessop Stephen M
Home Financials for this Owner
Home Financials are based on the most recent Mortgage that was taken out on this home.
Original Mortgage
$158,512
Interest Rate
5.91%
Mortgage Type
FHA
Purchase Details
Closed on
May 17, 2002
Sold by
Jackson Michael E and Jackson Angela D
Bought by
Gschwender Joseph J and Donegan Deborah
Home Financials for this Owner
Home Financials are based on the most recent Mortgage that was taken out on this home.
Original Mortgage
$132,900
Interest Rate
7%
Create a Home Valuation Report for This Property
The Home Valuation Report is an in-depth analysis detailing your home's value as well as a comparison with similar homes in the area
Home Values in the Area
Average Home Value in this Area
Purchase History
| Date | Buyer | Sale Price | Title Company |
|---|---|---|---|
| Ligotino John M | $139,900 | Sterling Title Inc | |
| Jessop Stephen M | $161,000 | Republic Title Agency Inc | |
| Gschwender Joseph J | $139,900 | -- |
Source: Public Records
Mortgage History
| Date | Status | Borrower | Loan Amount |
|---|---|---|---|
| Previous Owner | Ligotino John M | $139,850 | |
| Previous Owner | Jessop Stephen M | $158,512 | |
| Previous Owner | Gschwender Joseph J | $132,900 |
Source: Public Records
Tax History Compared to Growth
Tax History
| Year | Tax Paid | Tax Assessment Tax Assessment Total Assessment is a certain percentage of the fair market value that is determined by local assessors to be the total taxable value of land and additions on the property. | Land | Improvement |
|---|---|---|---|---|
| 2024 | $5,014 | $80,930 | $13,500 | $67,430 |
| 2023 | $5,014 | $80,930 | $13,500 | $67,430 |
| 2022 | $5,054 | $64,520 | $10,800 | $53,720 |
| 2021 | $4,673 | $64,520 | $10,800 | $53,720 |
| 2020 | $4,687 | $64,520 | $10,800 | $53,720 |
| 2019 | $4,308 | $52,410 | $10,800 | $41,610 |
| 2018 | $4,331 | $52,410 | $10,800 | $41,610 |
| 2017 | $3,988 | $52,410 | $10,800 | $41,610 |
| 2016 | $3,712 | $45,810 | $10,800 | $35,010 |
| 2015 | $3,545 | $45,810 | $10,800 | $35,010 |
| 2014 | $3,545 | $45,810 | $10,800 | $35,010 |
| 2012 | -- | $46,490 | $10,790 | $35,700 |
Source: Public Records
Map
Nearby Homes
- 2409 Burning Tree Dr
- 4408 Glenheath Dr
- 2447 Hemphill Rd
- 4210 Wallington Dr
- 4086 Glenheath Dr
- 4464 Woodner Dr
- 4370 Wilmington Pike
- 4533 Drayton Ct
- 2233 Cherry Oak Dr
- 2648 Parklawn Dr
- 2313 Glenheath Dr
- 4508 Rean Meadow Dr
- 2816 Corlington Dr
- 3033 Glenmere Ct
- 4190 Woodman Dr
- 2841 Corlington Dr
- 3073 Santa Rosa Dr
- 861 Acorn Dr
- 3034 Sandywood Dr
- 3072 Leonora Dr
- 4324 Appleton Place
- 4325 Glenheath Dr
- 4309 Glenheath Dr
- 2438 Hemphill Rd
- 4301 Glenheath Dr
- 4316 Appleton Place
- 4341 Glenheath Dr
- 4333 Appleton Place
- 2450 Hemphill Rd
- 4325 Appleton Place
- 2422 Hemphill Rd
- 4324 Glenheath Dr
- 4308 Appleton Place
- 4308 Glenheath Dr
- 4317 Appleton Place
- 4351 Appleton Place
- 2439 Hemphill Rd
- 2414 Hemphill Rd
- 4360 Glenheath Dr
- 2431 Hemphill Rd