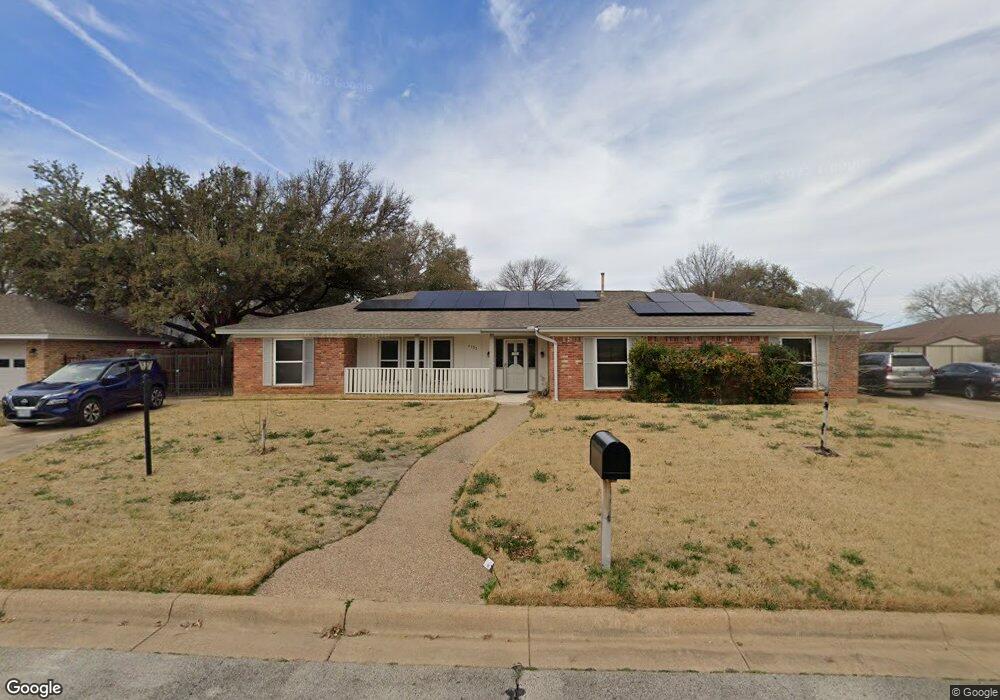
4332 Barcelona Dr Fort Worth, TX 76133
Wedgwood NeighborhoodEstimated Value: $345,000 - $378,255
4
Beds
3
Baths
2,635
Sq Ft
$139/Sq Ft
Est. Value
About This Home
This home is located at 4332 Barcelona Dr, Fort Worth, TX 76133 and is currently estimated at $365,314, approximately $138 per square foot. 4332 Barcelona Dr is a home located in Tarrant County with nearby schools including Woodway Elementary School, Wedgwood Middle School, and Wedgwood Sixth Grade Center.
Ownership History
Date
Name
Owned For
Owner Type
Purchase Details
Closed on
Mar 13, 2023
Sold by
Rook Stephen R
Bought by
Rook Living Trust
Current Estimated Value
Purchase Details
Closed on
Feb 23, 2001
Sold by
Buck James R and Buck Paula S
Bought by
Rook Stephen R and Rook Paulette N
Home Financials for this Owner
Home Financials are based on the most recent Mortgage that was taken out on this home.
Original Mortgage
$116,800
Interest Rate
6.97%
Purchase Details
Closed on
Nov 20, 1995
Sold by
Phh Real Estate Services Corp
Bought by
Buck James R and Buck Paula S
Home Financials for this Owner
Home Financials are based on the most recent Mortgage that was taken out on this home.
Original Mortgage
$81,600
Interest Rate
7.01%
Purchase Details
Closed on
Oct 10, 1995
Sold by
Smith G Blake and Smith Susan R
Bought by
Phh Real Estate Services Corp
Home Financials for this Owner
Home Financials are based on the most recent Mortgage that was taken out on this home.
Original Mortgage
$81,600
Interest Rate
7.01%
Create a Home Valuation Report for This Property
The Home Valuation Report is an in-depth analysis detailing your home's value as well as a comparison with similar homes in the area
Home Values in the Area
Average Home Value in this Area
Purchase History
| Date | Buyer | Sale Price | Title Company |
|---|---|---|---|
| Rook Living Trust | -- | -- | |
| Rook Stephen R | -- | Southwest Land Title | |
| Buck James R | -- | American Title Co | |
| Phh Real Estate Services Corp | -- | American Title |
Source: Public Records
Mortgage History
| Date | Status | Borrower | Loan Amount |
|---|---|---|---|
| Previous Owner | Rook Stephen R | $116,800 | |
| Previous Owner | Buck James R | $81,600 |
Source: Public Records
Tax History Compared to Growth
Tax History
| Year | Tax Paid | Tax Assessment Tax Assessment Total Assessment is a certain percentage of the fair market value that is determined by local assessors to be the total taxable value of land and additions on the property. | Land | Improvement |
|---|---|---|---|---|
| 2025 | $1,395 | $192,362 | $45,000 | $147,362 |
| 2024 | $1,395 | $228,730 | $45,000 | $183,730 |
| 2023 | $5,300 | $234,243 | $45,000 | $189,243 |
| 2022 | $5,737 | $220,704 | $45,000 | $175,704 |
| 2021 | $6,104 | $222,518 | $45,000 | $177,518 |
| 2020 | $5,421 | $204,812 | $45,000 | $159,812 |
| 2019 | $5,470 | $223,218 | $45,000 | $178,218 |
| 2018 | $2,909 | $180,756 | $35,000 | $145,756 |
| 2017 | $4,655 | $165,170 | $35,000 | $130,170 |
| 2016 | $4,232 | $149,385 | $35,000 | $114,385 |
| 2015 | $2,971 | $149,000 | $18,000 | $131,000 |
| 2014 | $2,971 | $149,000 | $18,000 | $131,000 |
Source: Public Records
Map
Nearby Homes
- 4401 Altamesa Blvd
- 4349 Altamesa Blvd
- 4313 Barcelona Dr
- 6309 Wallingford Dr
- 6602 Sabrosa Ct E
- 4255 Cadiz Dr
- 6758 Cartagena Ct
- 4555 Altamesa Blvd Unit 4553
- 6404 San Juan Ave
- 6800 Welch Ave
- 6400 Winn St
- 6049 Wimbleton Way
- 4713 Wheelock Dr
- 6809 Welch Ave
- 6112 Waco Way
- 6157 Whitman Ave
- 4721 Whistler Dr
- 6192 Wrigley Way
- 4700 Cinnamon Hill Dr
- 6052 Wrigley Way
- 4328 Barcelona Dr
- 6609 Del Prado Ave
- 4409 Altamesa Blvd
- 4409 Altamesa Blvd Unit 4409/4411
- 4411 Altamesa Blvd
- 6605 Del Prado Ave
- 4359 Balboa Dr
- 4324 Barcelona Dr
- 4405 Altamesa Blvd
- 6701 Del Prado Ave
- 4413 Altamesa Blvd
- 4415 Altamesa Blvd
- 4355 Balboa Dr
- 6601 Del Prado Ave
- 6608 Del Prado Ave
- 4320 Barcelona Dr
- 4403 Altamesa Blvd
- 4358 Balboa Dr
- 6604 Del Prado Ave
- 6705 Del Prado Ave