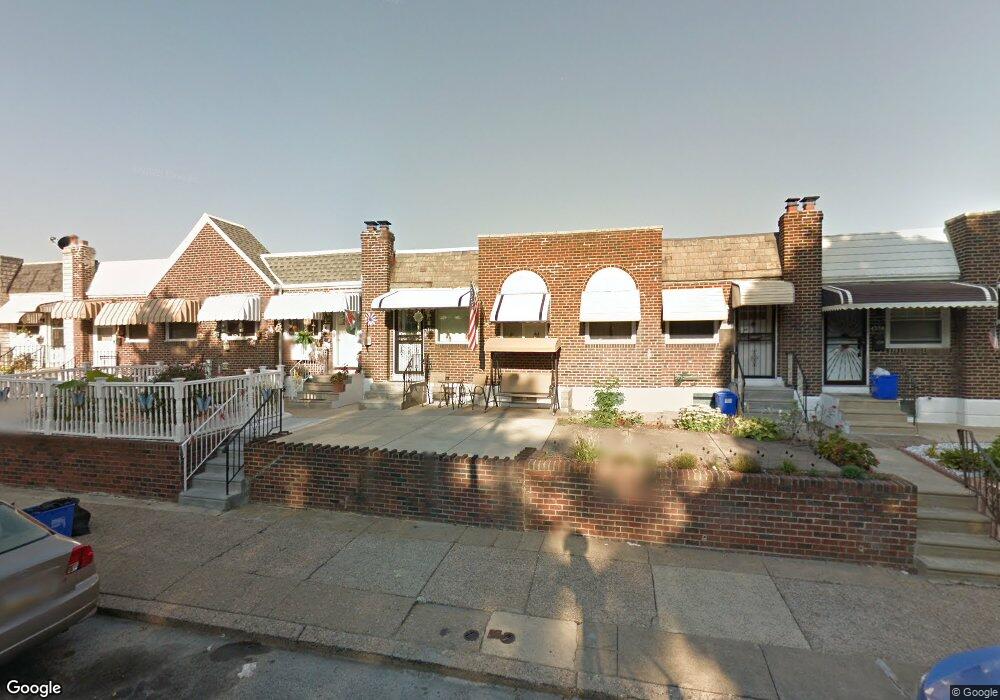
4332 Dungan St Philadelphia, PA 19124
Juniata Park NeighborhoodEstimated Value: $180,722 - $203,000
2
Beds
1
Bath
715
Sq Ft
$268/Sq Ft
Est. Value
About This Home
This home is located at 4332 Dungan St, Philadelphia, PA 19124 and is currently estimated at $191,931, approximately $268 per square foot. 4332 Dungan St is a home located in Philadelphia County with nearby schools including Frankford High School, Mariana Bracetti Academy Cs, and Holy Innocents Area Catholic Elementary School.
Ownership History
Date
Name
Owned For
Owner Type
Purchase Details
Closed on
May 20, 2003
Sold by
Hutchinson Robert H H and Will Of Edith S Reeves
Bought by
Brown Todd A
Current Estimated Value
Home Financials for this Owner
Home Financials are based on the most recent Mortgage that was taken out on this home.
Original Mortgage
$41,600
Outstanding Balance
$18,172
Interest Rate
5.86%
Mortgage Type
Purchase Money Mortgage
Estimated Equity
$173,759
Create a Home Valuation Report for This Property
The Home Valuation Report is an in-depth analysis detailing your home's value as well as a comparison with similar homes in the area
Home Values in the Area
Average Home Value in this Area
Purchase History
| Date | Buyer | Sale Price | Title Company |
|---|---|---|---|
| Brown Todd A | $52,000 | -- |
Source: Public Records
Mortgage History
| Date | Status | Borrower | Loan Amount |
|---|---|---|---|
| Open | Brown Todd A | $41,600 | |
| Closed | Brown Todd A | $10,400 |
Source: Public Records
Tax History Compared to Growth
Tax History
| Year | Tax Paid | Tax Assessment Tax Assessment Total Assessment is a certain percentage of the fair market value that is determined by local assessors to be the total taxable value of land and additions on the property. | Land | Improvement |
|---|---|---|---|---|
| 2025 | $2,065 | $165,600 | $33,120 | $132,480 |
| 2024 | $2,065 | $165,600 | $33,120 | $132,480 |
| 2023 | $2,065 | $147,500 | $29,500 | $118,000 |
| 2022 | $854 | $102,500 | $29,500 | $73,000 |
| 2021 | $1,484 | $0 | $0 | $0 |
| 2020 | $1,484 | $0 | $0 | $0 |
| 2019 | $1,377 | $0 | $0 | $0 |
| 2018 | $900 | $0 | $0 | $0 |
| 2017 | $1,320 | $0 | $0 | $0 |
| 2016 | $900 | $0 | $0 | $0 |
| 2015 | $862 | $0 | $0 | $0 |
| 2014 | -- | $94,300 | $19,374 | $74,926 |
| 2012 | -- | $11,296 | $1,588 | $9,708 |
Source: Public Records
Map
Nearby Homes