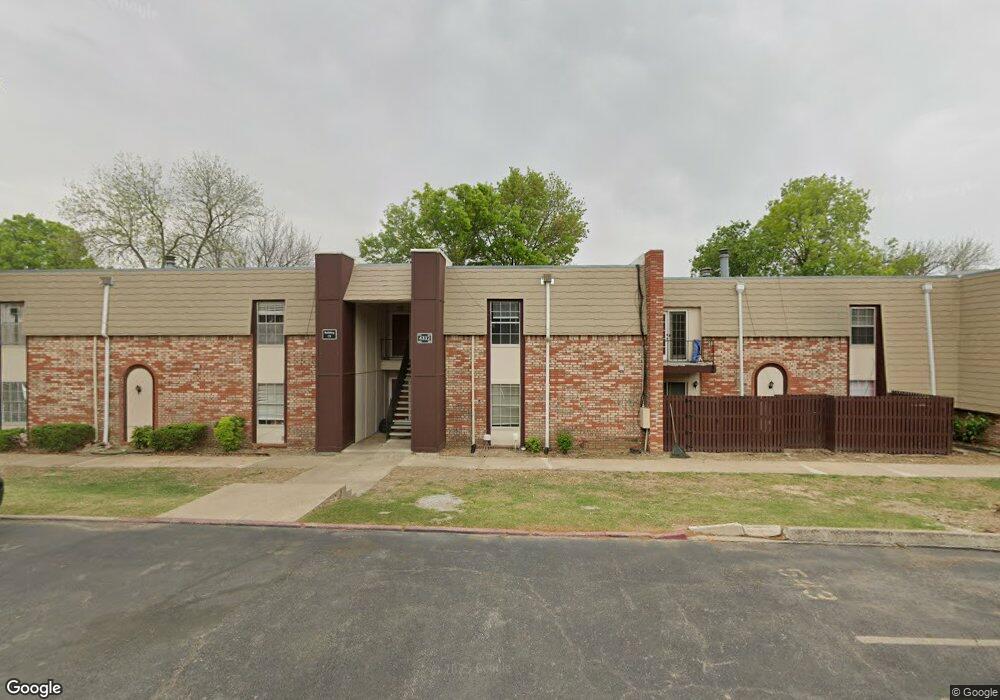
4332 E 67th St Unit C3 Tulsa, OK 74136
Livingston Park NeighborhoodEstimated Value: $76,000 - $88,734
Studio
2
Baths
1,130
Sq Ft
$73/Sq Ft
Est. Value
About This Home
This home is located at 4332 E 67th St Unit C3, Tulsa, OK 74136 and is currently estimated at $81,934, approximately $72 per square foot. 4332 E 67th St Unit C3 is a home located in Tulsa County with nearby schools including Jenks Middle School, Jenks West Intermediate Elementary School, and Jenks High School.
Ownership History
Date
Name
Owned For
Owner Type
Purchase Details
Closed on
Dec 23, 2019
Sold by
Future Point Investments Llc
Bought by
Dockray Michelle Elizabeth and Dockray Riley James
Current Estimated Value
Home Financials for this Owner
Home Financials are based on the most recent Mortgage that was taken out on this home.
Original Mortgage
$38,034
Outstanding Balance
$25,485
Interest Rate
3.7%
Mortgage Type
New Conventional
Estimated Equity
$56,449
Purchase Details
Closed on
Nov 18, 2016
Sold by
Khouri Raja
Bought by
Future Point Investments Llc
Purchase Details
Closed on
Sep 17, 2014
Sold by
Infinity Real Estate Llc
Bought by
Khouri Raja
Purchase Details
Closed on
Apr 26, 2005
Sold by
Willow Creek Condominium Third Inc
Bought by
Newton Elva E Schindler
Purchase Details
Closed on
Apr 15, 2005
Sold by
Newton Elva E Schindler
Bought by
Solberg Lynn D
Purchase Details
Closed on
Dec 1, 1996
Purchase Details
Closed on
Oct 1, 1993
Create a Home Valuation Report for This Property
The Home Valuation Report is an in-depth analysis detailing your home's value as well as a comparison with similar homes in the area
Home Values in the Area
Average Home Value in this Area
Purchase History
| Date | Buyer | Sale Price | Title Company |
|---|---|---|---|
| Dockray Michelle Elizabeth | $42,500 | Multiple | |
| Dockray Michelle Elizabeth | $42,500 | Multiple | |
| Future Point Investments Llc | -- | None Available | |
| Future Point Investments Llc | -- | None Available | |
| Khouri Raja | $15,000 | True Title & Escrow | |
| Khouri Raja | $15,000 | True Title & Escrow | |
| Newton Elva E Schindler | -- | -- | |
| Newton Elva E Schindler | -- | -- | |
| Solberg Lynn D | $48,500 | -- | |
| Solberg Lynn D | $48,500 | -- | |
| -- | $37,000 | -- | |
| -- | $37,000 | -- | |
| -- | $31,000 | -- | |
| -- | $31,000 | -- |
Source: Public Records
Mortgage History
| Date | Status | Borrower | Loan Amount |
|---|---|---|---|
| Open | Dockray Michelle Elizabeth | $38,034 |
Source: Public Records
Tax History
| Year | Tax Paid | Tax Assessment Tax Assessment Total Assessment is a certain percentage of the fair market value that is determined by local assessors to be the total taxable value of land and additions on the property. | Land | Improvement |
|---|---|---|---|---|
| 2025 | $694 | $4,908 | $430 | $4,478 |
| 2024 | $622 | $4,675 | $814 | $3,861 |
| 2023 | $622 | $4,675 | $814 | $3,861 |
| 2022 | $642 | $4,675 | $814 | $3,861 |
| 2021 | $651 | $4,675 | $814 | $3,861 |
| 2020 | $637 | $4,675 | $814 | $3,861 |
| 2019 | $403 | $2,860 | $814 | $2,046 |
| 2018 | $403 | $2,860 | $814 | $2,046 |
| 2017 | $393 | $2,860 | $814 | $2,046 |
| 2016 | $380 | $2,750 | $814 | $1,936 |
| 2015 | $387 | $2,750 | $814 | $1,936 |
| 2014 | $386 | $2,750 | $814 | $1,936 |
Source: Public Records
Map
Nearby Homes
- 4342 E 67th St Unit 694
- 4336 E 67th St Unit 689
- 4333 E 68th St Unit C2-604
- 4326 E 67th St Unit 679
- 4328 E 67th St Unit 680
- 4406 E 68th St Unit 472
- 4304 E 67th St Unit 558
- 4303 E 68th St Unit 628
- 4444 E 68th St Unit 390
- 4444 E 68th St Unit 490
- 4446 E 68th St Unit 392
- 6804 S Toledo Ave Unit 404
- 6717 S Oswego Ave
- 4670 E 68th St Unit 173
- 4670 E 68th St Unit 273
- 4640 E 68th St Unit 183
- 4606 E 68th St Unit 123
- 4614 E 68th St Unit 119
- 4624 E 68th St Unit 114
- 4812 E 68th St Unit 107
- 4330 E 67th St Unit C3
- 4317 E 68th St Unit C4
- 4327 E 68th St Unit C4
- 4317 E 68th St Unit C4
- 4317 E 68th St Unit C4
- 4323 E 68th St Unit C4
- 4323 E 68th St Unit 514
- 4323 E 68th St Unit C4
- 4334 E 67th St Unit C3
- 4334 E 67th St Unit C3
- 4334 E 67th St Unit C3
- 4332 E 67th St Unit C3
- 4332 E 67th St Unit C3
- 4330 E 67th St Unit C3
- 4330 E 67th St Unit C3
- 4327 E 68th St Unit C3
- 4329 E 68th St Unit C3
- 4329 E 68th St Unit C2
- 4331 E 68th St Unit C2
- 4331 E 68th St Unit C2
Your Personal Tour Guide
Ask me questions while you tour the home.