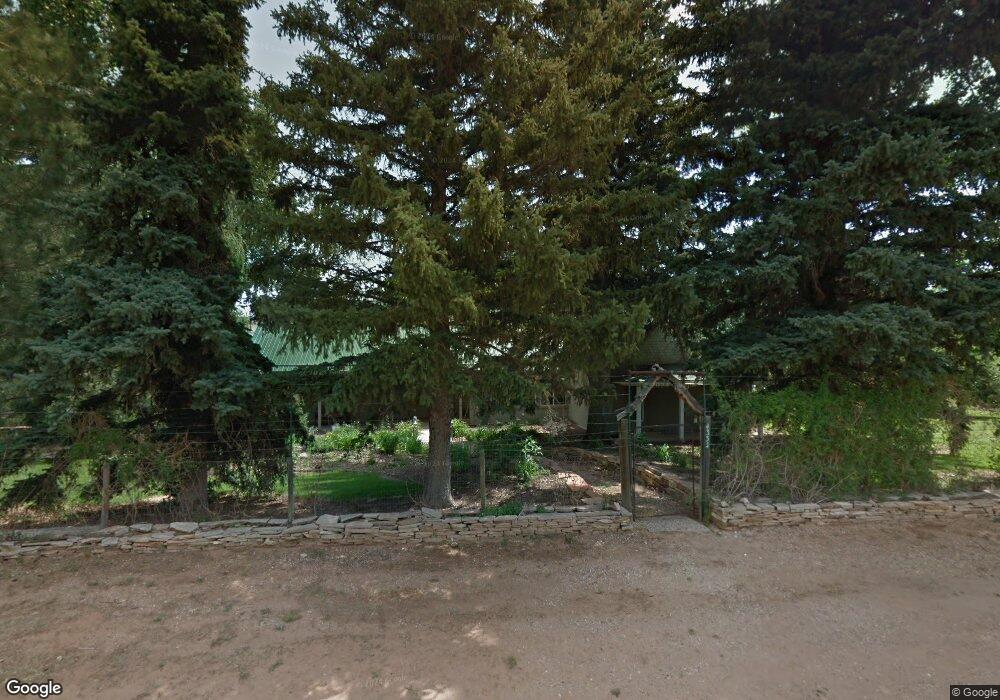
4332 Filter Plant Rd Bellvue, CO 80512
Estimated Value: $579,000 - $1,647,000
3
Beds
4
Baths
2,106
Sq Ft
$458/Sq Ft
Est. Value
About This Home
This home is located at 4332 Filter Plant Rd, Bellvue, CO 80512 and is currently estimated at $965,174, approximately $458 per square foot. 4332 Filter Plant Rd is a home located in Larimer County with nearby schools including Cache La Poudre Elementary School and Poudre High School.
Ownership History
Date
Name
Owned For
Owner Type
Purchase Details
Closed on
Aug 29, 2003
Sold by
Evans Robert W
Bought by
Adams James L
Current Estimated Value
Home Financials for this Owner
Home Financials are based on the most recent Mortgage that was taken out on this home.
Original Mortgage
$250,000
Outstanding Balance
$113,016
Interest Rate
5.87%
Mortgage Type
Purchase Money Mortgage
Estimated Equity
$852,158
Purchase Details
Closed on
Jul 16, 1998
Sold by
Evans Robert W and Dornseif Mary A
Bought by
Evans Robert W
Home Financials for this Owner
Home Financials are based on the most recent Mortgage that was taken out on this home.
Original Mortgage
$120,400
Interest Rate
6.94%
Purchase Details
Closed on
Feb 12, 1996
Sold by
Evans Robert W and Evans Kathy
Bought by
Evans Robert W
Purchase Details
Closed on
Jun 10, 1992
Sold by
Evans Robert W
Bought by
Evans Robert W and Evans Kathy
Create a Home Valuation Report for This Property
The Home Valuation Report is an in-depth analysis detailing your home's value as well as a comparison with similar homes in the area
Home Values in the Area
Average Home Value in this Area
Purchase History
| Date | Buyer | Sale Price | Title Company |
|---|---|---|---|
| Adams James L | $300,000 | -- | |
| Evans Robert W | -- | -- | |
| Evans Robert W | -- | -- | |
| Evans Robert W | -- | -- |
Source: Public Records
Mortgage History
| Date | Status | Borrower | Loan Amount |
|---|---|---|---|
| Open | Adams James L | $250,000 | |
| Previous Owner | Evans Robert W | $120,400 |
Source: Public Records
Tax History Compared to Growth
Tax History
| Year | Tax Paid | Tax Assessment Tax Assessment Total Assessment is a certain percentage of the fair market value that is determined by local assessors to be the total taxable value of land and additions on the property. | Land | Improvement |
|---|---|---|---|---|
| 2025 | $3,426 | $45,627 | $2,479 | $43,148 |
| 2024 | $3,261 | $45,627 | $2,479 | $43,148 |
| 2022 | $2,360 | $31,672 | $2,572 | $29,100 |
| 2021 | $2,380 | $32,583 | $2,646 | $29,937 |
| 2020 | $2,761 | $36,401 | $2,646 | $33,755 |
| 2019 | $2,774 | $36,401 | $2,646 | $33,755 |
| 2018 | $2,318 | $32,414 | $2,664 | $29,750 |
| 2017 | $2,310 | $32,414 | $2,664 | $29,750 |
| 2016 | $675 | $14,662 | $2,945 | $11,717 |
| 2015 | $670 | $14,670 | $2,950 | $11,720 |
| 2014 | $1,354 | $22,690 | $2,950 | $19,740 |
Source: Public Records
Map
Nearby Homes
- 4516 Del Colina Way
- 3501 Raptor Ridge Ln
- 4442 Del Colina Way
- 4520 W County Road 54g
- 2720 N County Road 23
- 0 Pine Acres Way Unit 1045910
- 2921 Lochlomond Dr
- 3328 Mcconnell Dr
- 3405 Post Rd
- 4516 Bingham Hill Rd
- 898 Hernia Hill Trail
- 3308 Innisfree Ln
- 1600 Whale Rock Rd
- 0 Pine Acres Rd Unit 1041697
- 2833 N Overland Trail
- 2824 N Overland Trail
- 100 Canyon Gulch Rd
- 2518 Whale Rock Rd
- 6699 Savvy Place
- 0 Dakota Valley Dr Unit 1041548
- 4335 Filter Plant Rd
- 4233 Filter Plant Rd
- 4333 Filter Plant Rd
- 4213 Filter Plant Rd
- 4216 Filter Plant Rd
- 6004 W County Road 54 E
- 6020 W County Road 54 E
- 6200 W County Road 54 E
- 6002 W County Road 54 E
- 6002 W County Road 54 E
- 6220 W County Road 54 E
- 6300 W County Road 54 E
- 5720 W County Road 54 E
- 4032 N County Road 25 E
- 6532 W County Road 54 E
- 3933 N County Road 25 E
- 4116 N County Road 27 E
- 3928 N County Road 25 E
- 3901 N County Road 25 E
- 4133 N County Road 27 E