P
Landlord's Agent in 2025
Property Management
Live Oak Real Estate
Estimated Value: $221,000 - $231,000
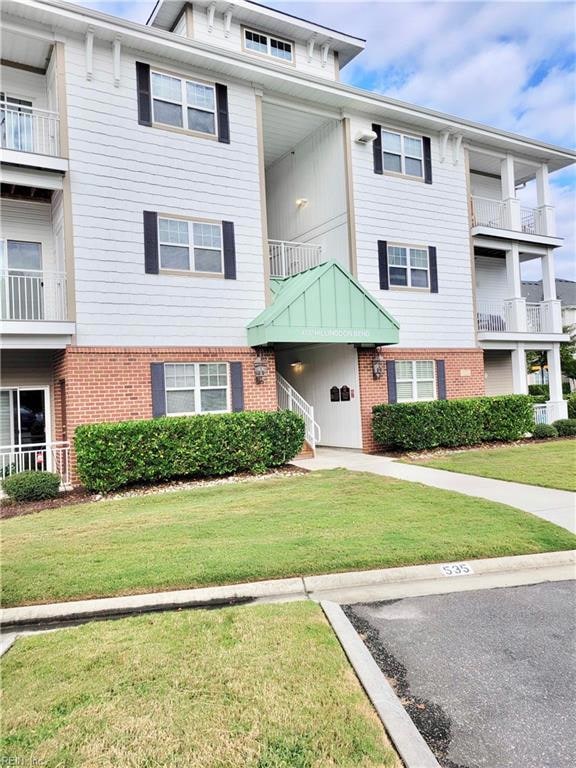
- Open floor plan with gourmet kitchen with Stainless Steel Appliances
- Two spacious bedrooms, 2 full baths
- Updated Vanities in Bathrooms
- Washer and Dryer
- Included in Rent Water, Sewer, Trash
- Condo amenties include pool, clubhouse with grills, walking/bike trails, dog stations
- Less than 1 mile from major Interstate (664) and Chesapeake Square Shopping District.
- 5 miles to Suffolk Joint DoD Complex, 7 miles to Norfolk Naval Shipyard and Portsmouth Naval Medical Center
- Pets on a case by case basis. no more than one cat or dog up to 35lbs in weight. $25/month pet rent shall apply and an additional $250 Pet deposit shall also apply.
Last Agent to Rent the Property
Property Management
Live Oak Real Estate Listed on: 06/16/2025
| Date | Buyer | Sale Price | Title Company |
|---|---|---|---|
| Johnson Roy R | $175,000 | Attorney | |
| Robinson Erika | $132,015 | -- |
| Date | Status | Borrower | Loan Amount |
|---|---|---|---|
| Previous Owner | Robinson Erika | $129,623 |
| Date | Event | Price | List to Sale | Price per Sq Ft |
|---|---|---|---|---|
| 06/20/2025 06/20/25 | Rented | $1,595 | 0.0% | -- |
| 06/16/2025 06/16/25 | For Rent | $1,595 | -- | -- |
| Year | Tax Paid | Tax Assessment Tax Assessment Total Assessment is a certain percentage of the fair market value that is determined by local assessors to be the total taxable value of land and additions on the property. | Land | Improvement |
|---|---|---|---|---|
| 2025 | $2,122 | $217,500 | $65,000 | $152,500 |
| 2024 | $2,122 | $210,100 | $65,000 | $145,100 |
| 2023 | $1,727 | $186,700 | $55,000 | $131,700 |
| 2022 | $1,703 | $168,600 | $45,000 | $123,600 |
| 2021 | $1,615 | $153,800 | $45,000 | $108,800 |
| 2020 | $1,449 | $138,000 | $45,000 | $93,000 |
| 2019 | $1,449 | $138,000 | $45,000 | $93,000 |
| 2018 | $1,500 | $0 | $0 | $0 |
| 2017 | $1,423 | $135,500 | $35,000 | $100,500 |
| 2016 | $1,392 | $132,600 | $35,000 | $97,600 |
| 2015 | $1,450 | $138,100 | $35,000 | $103,100 |
P
Landlord's Agent in 2025
Property Management
Live Oak Real Estate

Tenant's Agent in 2025
Dina Spiva
The Real Estate Group
(757) 955-5705
1 in this area
36 Total Sales
Source: Real Estate Information Network (REIN)
MLS Number: 10588594
APN: 0093005001750
Disclaimer: Certain information contained herein is derived from information provided by parties other than Homes.com. All information provided is deemed reliable, but is not guaranteed to be accurate and should be independently verified.
![]() The listings data displayed on this medium comes in part from the Real Estate Information Network, Inc. (REIN) and has been authorized by participating listing Broker Members of REIN for display. REIN's listings are based upon Data submitted by its Broker Members, and REIN therefore makes no representation or warranty regarding the accuracy of the Data. All users of REIN's listings database should confirm the accuracy of the listing information directly with the listing agent.
The listings data displayed on this medium comes in part from the Real Estate Information Network, Inc. (REIN) and has been authorized by participating listing Broker Members of REIN for display. REIN's listings are based upon Data submitted by its Broker Members, and REIN therefore makes no representation or warranty regarding the accuracy of the Data. All users of REIN's listings database should confirm the accuracy of the listing information directly with the listing agent.
Copyright 2025 REIN. REIN's listings Data and information is protected under federal copyright laws. Federal law prohibits, among other acts, the unauthorized copying or alteration of, or preparation of derivative works from, all or any part of copyrighted materials, including certain compilations of Data and information. COPYRIGHT VIOLATORS MAY BE SUBJECT TO SEVERE FINES AND PENALTIES UNDER FEDERAL LAW.
REIN updates its listings on a daily basis.
Some listings may be duplicated in the search results due to the co-mingling of listings from more than one multiple listing service. Should there be different listing information between the duplicated listings; user is advised to verify the accuracy of the listing information before making any financial decisions.
Some or all of the listings (or listings Data) represented in this application have been enhanced with Data not provided by REIN. The enhancements are as follows: mapping, demographics, and economics. The source of these enhancements are: GreatSchools, CoStar, Google, Walk Score, How Loud, Collateral Analytics, Black Knight, First American, and Quantarium.
This application does not include information on all of the properties available for sale at this time.