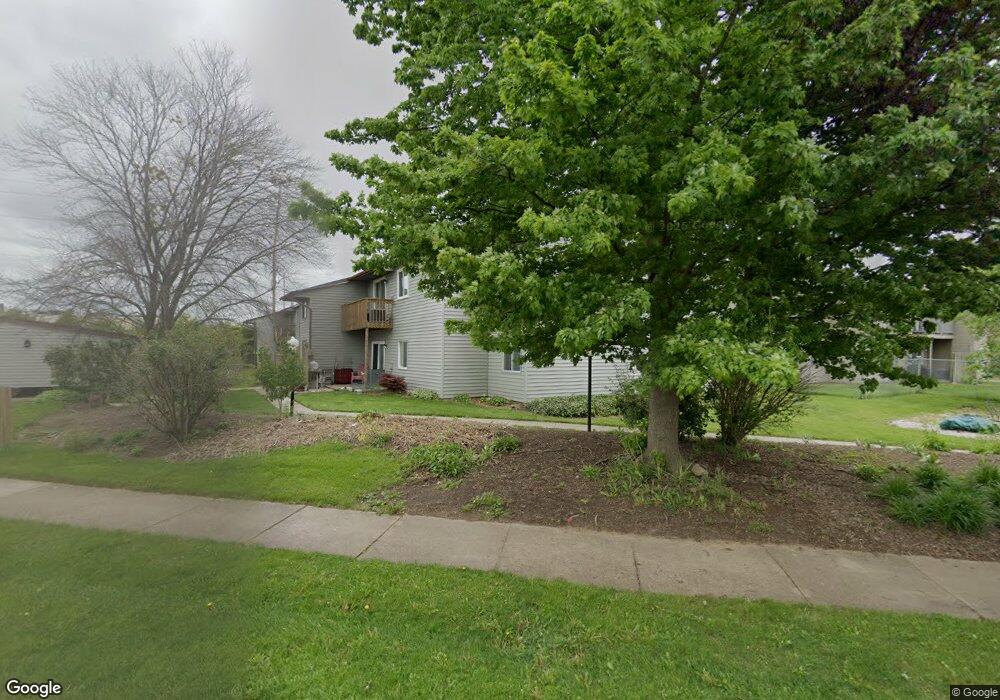
4332 Norman Dr SE Unit 2 Grand Rapids, MI 49508
Ken-O-Sha Park NeighborhoodEstimated Value: $140,000 - $177,000
2
Beds
2
Baths
850
Sq Ft
$189/Sq Ft
Est. Value
About This Home
This home is located at 4332 Norman Dr SE Unit 2, Grand Rapids, MI 49508 and is currently estimated at $160,348, approximately $188 per square foot. 4332 Norman Dr SE Unit 2 is a home located in Kent County with nearby schools including Bowen Elementary, Crestwood Middle School, and East Kentwood High School.
Ownership History
Date
Name
Owned For
Owner Type
Purchase Details
Closed on
Oct 21, 2004
Sold by
Hud
Bought by
Vanderlaan Andrew H and Vanderlaan Andrew
Current Estimated Value
Home Financials for this Owner
Home Financials are based on the most recent Mortgage that was taken out on this home.
Original Mortgage
$48,158
Interest Rate
5.8%
Mortgage Type
Construction
Purchase Details
Closed on
Sep 23, 2003
Sold by
Mortgage Electronic Registration Systems
Bought by
Hud
Purchase Details
Closed on
Sep 3, 2003
Sold by
Byer Lawrence S
Bought by
Mortgage Electronic Registration Systems
Purchase Details
Closed on
Sep 20, 2000
Sold by
Blauwkamp Blauwkamp K K and Blauwkamp Byer L
Bought by
Vanderlaan Byer L and Vanderlaan Andrew
Purchase Details
Closed on
Dec 23, 1999
Sold by
Johnson Johnson W W and Johnson Blauwkmp K
Bought by
Vanderlaan Blauwkmp K and Vanderlaan Andrew
Purchase Details
Closed on
Sep 29, 1994
Sold by
Sturrus Sturrus T T and Sturrus Johnson W
Bought by
Vanderlaan Andrew
Purchase Details
Closed on
Jan 21, 1992
Sold by
Struyk Struyk D D and Struyk Jelsema C
Bought by
Vanderlaan Andrew
Purchase Details
Closed on
Mar 24, 1987
Create a Home Valuation Report for This Property
The Home Valuation Report is an in-depth analysis detailing your home's value as well as a comparison with similar homes in the area
Home Values in the Area
Average Home Value in this Area
Purchase History
| Date | Buyer | Sale Price | Title Company |
|---|---|---|---|
| Vanderlaan Andrew H | $48,158 | -- | |
| Hud | -- | -- | |
| Mortgage Electronic Registration Systems | $56,597 | -- | |
| Vanderlaan Byer L | $54,900 | -- | |
| Vanderlaan Blauwkmp K | $49,900 | -- | |
| Vanderlaan Andrew | $31,500 | -- | |
| Vanderlaan Andrew | $41,000 | -- | |
| -- | $39,800 | -- |
Source: Public Records
Mortgage History
| Date | Status | Borrower | Loan Amount |
|---|---|---|---|
| Closed | Vanderlaan Andrew H | $48,158 |
Source: Public Records
Tax History Compared to Growth
Tax History
| Year | Tax Paid | Tax Assessment Tax Assessment Total Assessment is a certain percentage of the fair market value that is determined by local assessors to be the total taxable value of land and additions on the property. | Land | Improvement |
|---|---|---|---|---|
| 2025 | $541 | $68,500 | $0 | $0 |
| 2024 | $541 | $63,700 | $0 | $0 |
| 2023 | $548 | $49,300 | $0 | $0 |
| 2022 | $520 | $46,100 | $0 | $0 |
| 2021 | $512 | $40,900 | $0 | $0 |
| 2020 | $476 | $32,000 | $0 | $0 |
| 2019 | $498 | $28,400 | $0 | $0 |
| 2018 | $488 | $26,000 | $0 | $0 |
| 2017 | $716 | $22,000 | $0 | $0 |
| 2016 | $699 | $14,000 | $0 | $0 |
| 2015 | $682 | $14,000 | $0 | $0 |
| 2013 | -- | $23,700 | $0 | $0 |
Source: Public Records
Map
Nearby Homes
- 4324 Norman Dr SE Unit 14
- 4331 Kimball Ave SE
- 1447 N Saxony Dr SE Unit 19
- 1675 Langley St SE
- 1229 44th St SE
- 4130 Norman Dr SE
- 1521 Blossom St SE
- 4321 Kentridge Dr SE
- 1419 Pickett St SE
- 1303 Richwood Dr SE
- 3826 Kirkshire Dr SE
- 4761 Kalamazoo Ave SE
- 1541 48th St SE
- 1822 S Norwalk Dr SE
- 1563 Amberly Dr SE
- 4608 Crosswinds Dr SE
- 4481 Marshall Ave SE
- 4914 Curwood Ave SE
- 4690 Stauffer Ave SE
- 1903 Whistle Stop Dr SE
- 4338 Norman Dr SE Unit 12
- 4336 Norman Dr SE
- 4340 Norman Dr SE
- 4342 Norman Dr SE Unit 9
- 4314 Norman Dr SE
- 4316 Norman Dr SE Unit 6
- 4318 Norman Dr SE Unit 5
- 4330 Norman Dr SE
- 4328 Norman Dr SE
- 4334 Norman Dr SE Unit 1
- 4336 Norman Dr SE Unit 11
- 4320 Norman Dr SE
- 4312 Norman Dr SE
- 4322 Norman Dr SE
- 4346 Norman Drive St SE Unit 102
- 4310 Norman Dr SE
- 4346 Norman Dr SE Unit 11
- 4346 Norman Dr SE Unit 10
- 4346 Norman Dr SE Unit 9
- 4346 Norman Dr SE Unit 4