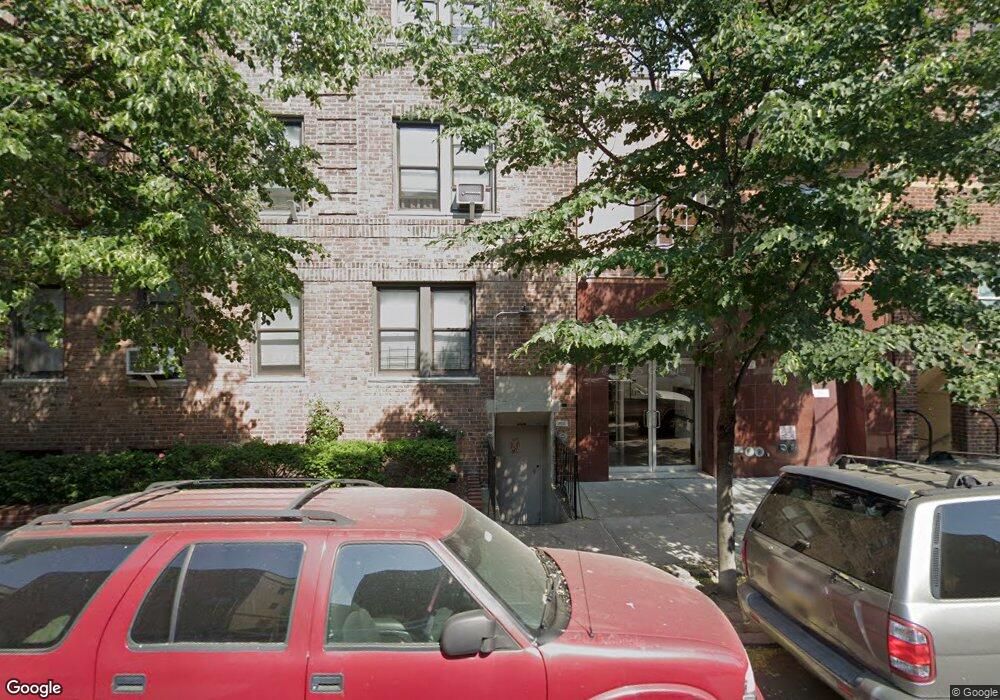
4333 42nd St Unit 3A Sunnyside, NY 11104
Sunnyside NeighborhoodEstimated Value: $421,000 - $511,000
1
Bed
1
Bath
518
Sq Ft
$898/Sq Ft
Est. Value
About This Home
This home is located at 4333 42nd St Unit 3A, Sunnyside, NY 11104 and is currently estimated at $464,966, approximately $897 per square foot. 4333 42nd St Unit 3A is a home located in Queens County with nearby schools including P.S. 150Q Sunnyside, Long Island City High School, and Most Precious Blood Roman Catholic Church.
Ownership History
Date
Name
Owned For
Owner Type
Purchase Details
Closed on
Feb 28, 2019
Sold by
Grippo Marie Elena
Bought by
Marie Elena Grippo 2016 Revocable Living and Marie Elena Grippo, Trustee
Current Estimated Value
Purchase Details
Closed on
Nov 1, 2018
Sold by
Chen Daniel Z
Bought by
Grippo Marie Elena and Perez Juan Carlos
Home Financials for this Owner
Home Financials are based on the most recent Mortgage that was taken out on this home.
Original Mortgage
$320,000
Interest Rate
4.7%
Mortgage Type
Unknown
Purchase Details
Closed on
Feb 1, 2011
Sold by
Golden Properties Development Group Llc
Bought by
Chen Daniel Z
Home Financials for this Owner
Home Financials are based on the most recent Mortgage that was taken out on this home.
Original Mortgage
$214,000
Interest Rate
4.77%
Mortgage Type
Purchase Money Mortgage
Create a Home Valuation Report for This Property
The Home Valuation Report is an in-depth analysis detailing your home's value as well as a comparison with similar homes in the area
Home Values in the Area
Average Home Value in this Area
Purchase History
| Date | Buyer | Sale Price | Title Company |
|---|---|---|---|
| Marie Elena Grippo 2016 Revocable Living | -- | -- | |
| Grippo Marie Elena | $520,000 | -- | |
| Chen Daniel Z | $271,245 | -- |
Source: Public Records
Mortgage History
| Date | Status | Borrower | Loan Amount |
|---|---|---|---|
| Previous Owner | Grippo Marie Elena | $320,000 | |
| Previous Owner | Grippo Marie Elena | $320,000 | |
| Previous Owner | Chen Daniel Z | $214,000 |
Source: Public Records
Tax History Compared to Growth
Tax History
| Year | Tax Paid | Tax Assessment Tax Assessment Total Assessment is a certain percentage of the fair market value that is determined by local assessors to be the total taxable value of land and additions on the property. | Land | Improvement |
|---|---|---|---|---|
| 2025 | $6,393 | $66,395 | $2,387 | $64,008 |
| 2024 | $6,393 | $61,477 | $3,579 | $57,898 |
| 2023 | $6,254 | $76,846 | $2,737 | $74,109 |
| 2022 | $3,649 | $77,818 | $2,651 | $75,167 |
| 2021 | $2,629 | $79,718 | $2,651 | $77,067 |
| 2020 | $1,220 | $87,319 | $2,651 | $84,668 |
| 2019 | $1,234 | $73,444 | $2,651 | $70,793 |
| 2018 | $1,244 | $61,026 | $2,644 | $58,382 |
| 2017 | $1,244 | $56,506 | $2,596 | $53,910 |
| 2016 | $1,261 | $56,506 | $2,596 | $53,910 |
| 2015 | -- | $53,977 | $2,593 | $51,384 |
| 2014 | -- | $49,979 | $2,652 | $47,327 |
Source: Public Records
Map
Nearby Homes
- 4333 42nd St Unit 6A
- 43-33 42nd St Unit 6B
- 43-13 Queens Blvd
- 41-22 44th St
- 41-42 42nd St Unit E4
- 41-02 Queens Blvd Unit 4E
- 41-02 Queens Blvd Unit 5-E
- 45-14 43rd St Unit 2D
- 45-14 43rd St Unit 3E
- 41-41 41st St Unit 1G
- 4520 43rd St Unit 2C
- 45-20 43rd St Unit 1D
- 43-32 40th St
- 2594 40th St
- 4805 42nd St Unit 5G
- 45-08 40th St Unit F44
- 45-08 40th St Unit F32
- 44-15 43rd Ave Unit 5N
- 41-25 44th St Unit C5
- 45-32 41st St
- 43-33 42nd St Unit 2B
- 43-33 42nd St Unit 4
- 43-33 42nd St Unit 6A
- 43-33 42nd St
- 43-33 42nd St Unit 2A
- 43-33 42nd St Unit 6-A
- 4333 42nd St Unit 3B
- 4333 42nd St Unit 4B
- 4333 42nd St
- 4333 42nd St Unit 5A
- 4333 42nd St Unit 2B
- 4333 42nd St Unit 6B
- 4333 42nd St Unit 2A
- 4333 42nd St Unit 5B
- 4333 42nd St Unit 4A
- 4335 42nd St
- 4323 42nd St
- 4323 42nd St
- 4339 42nd St
- 43-39 42nd St Unit 2D