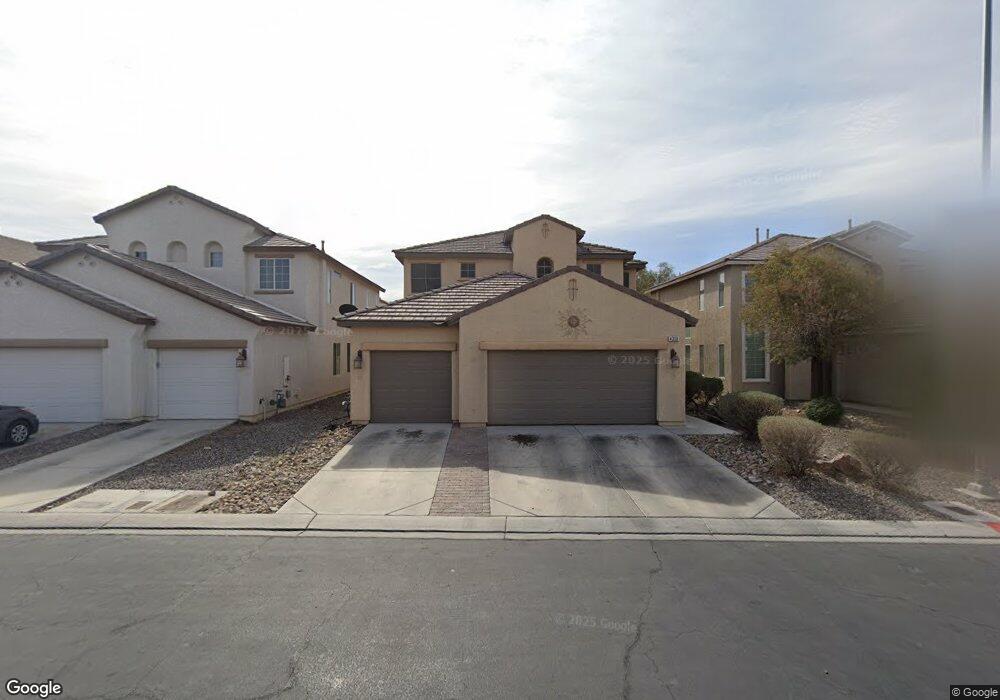
4333 Bacara Ridge Ave Las Vegas, NV 89115
Estimated Value: $409,000 - $485,000
3
Beds
3
Baths
2,222
Sq Ft
$200/Sq Ft
Est. Value
About This Home
This home is located at 4333 Bacara Ridge Ave, Las Vegas, NV 89115 and is currently estimated at $443,865, approximately $199 per square foot. 4333 Bacara Ridge Ave is a home located in Clark County with nearby schools including D.L. Dusty Dickens Elementary School, Carroll M. Johnston STEM Academy of Environmental Studies, and Clifford O. Findlay Middle School.
Ownership History
Date
Name
Owned For
Owner Type
Purchase Details
Closed on
Sep 22, 2008
Sold by
Payan Claudia Veronica
Bought by
Torres Alfredo T
Current Estimated Value
Home Financials for this Owner
Home Financials are based on the most recent Mortgage that was taken out on this home.
Original Mortgage
$181,800
Outstanding Balance
$120,864
Interest Rate
6.51%
Mortgage Type
Unknown
Estimated Equity
$323,001
Purchase Details
Closed on
Aug 27, 2008
Sold by
Guardado Franklin
Bought by
Torres Alfredo T
Home Financials for this Owner
Home Financials are based on the most recent Mortgage that was taken out on this home.
Original Mortgage
$181,800
Outstanding Balance
$120,864
Interest Rate
6.51%
Mortgage Type
Unknown
Estimated Equity
$323,001
Purchase Details
Closed on
May 23, 2006
Sold by
Richmond American Homes Of Nevada Inc
Bought by
Guardado Franklin
Home Financials for this Owner
Home Financials are based on the most recent Mortgage that was taken out on this home.
Original Mortgage
$275,100
Interest Rate
6.5%
Mortgage Type
Unknown
Create a Home Valuation Report for This Property
The Home Valuation Report is an in-depth analysis detailing your home's value as well as a comparison with similar homes in the area
Home Values in the Area
Average Home Value in this Area
Purchase History
| Date | Buyer | Sale Price | Title Company |
|---|---|---|---|
| Torres Alfredo T | -- | Chicago Title The Pointe | |
| Torres Alfredo T | $202,000 | Chicago Title The Pointe | |
| Guardado Franklin | -- | Chicago Title The Pointe | |
| Guardado Franklin | $343,876 | Ticor Title Of Nevada Inc | |
| Guardado Franklin | -- | Ticor Title Of Nevada Inc |
Source: Public Records
Mortgage History
| Date | Status | Borrower | Loan Amount |
|---|---|---|---|
| Open | Torres Alfredo T | $181,800 | |
| Previous Owner | Guardado Franklin | $275,100 |
Source: Public Records
Tax History Compared to Growth
Tax History
| Year | Tax Paid | Tax Assessment Tax Assessment Total Assessment is a certain percentage of the fair market value that is determined by local assessors to be the total taxable value of land and additions on the property. | Land | Improvement |
|---|---|---|---|---|
| 2025 | $2,238 | $131,315 | $32,550 | $98,765 |
| 2024 | $2,072 | $131,315 | $32,550 | $98,765 |
| 2023 | $2,072 | $121,803 | $28,700 | $93,103 |
| 2022 | $1,919 | $110,005 | $25,200 | $84,805 |
| 2021 | $1,777 | $97,905 | $22,400 | $75,505 |
| 2020 | $1,647 | $91,667 | $21,700 | $69,967 |
| 2019 | $1,544 | $89,476 | $19,250 | $70,226 |
| 2018 | $1,473 | $74,555 | $14,700 | $59,855 |
| 2017 | $2,249 | $67,002 | $14,000 | $53,002 |
| 2016 | $1,380 | $58,135 | $10,150 | $47,985 |
| 2015 | $1,376 | $50,476 | $8,400 | $42,076 |
| 2014 | $1,336 | $43,593 | $5,950 | $37,643 |
Source: Public Records
Map
Nearby Homes
- 4405 San Gabriel Hill Ave
- 6117 Glenborough St
- 4216 Mount Bonnell Ave
- Plan 2175 at Briscoe
- Plan 1453 Modeled at Briscoe
- Plan 2333 Modeled at Briscoe
- Plan 2784 at Briscoe
- 6117 Bugsy St
- 4212 Mount Bonnell Ave
- 6225 Gambetta St
- 4146 Nipp Ave
- 6205 Grace Mountain St
- 4221 Zilker Park Ave
- 4200 Zilker Park Ave
- 4209 Zilker Park Ave
- 6220 Novak St
- 4211 Enchanting Sky Ave
- 4205 Zilker Park Ave
- 5945 Violet Crown St
- 6232 Novak St
- 4337 Bacara Ridge Ave
- 4329 Bacara Ridge Ave
- 4325 Bacara Ridge Ave
- 4341 Bacara Ridge Ave
- 4336 San Gabriel Hill Ave
- 4340 San Gabriel Hill Ave
- 4321 Bacara Ridge Ave
- 4332 Bacara Ridge Ave
- 4345 Bacara Ridge Ave
- 4336 Bacara Ridge Ave
- 4328 Bacara Ridge Ave
- 4340 Bacara Ridge Ave
- 4324 Bacara Ridge Ave
- 4344 San Gabriel Hill Ave
- 4317 Bacara Ridge Ave
- 4349 Bacara Ridge Ave
- 4344 Bacara Ridge Ave
- 4320 Bacara Ridge Ave
- 4348 San Gabriel Hill Ave
- 4329 San Gabriel Hill Ave