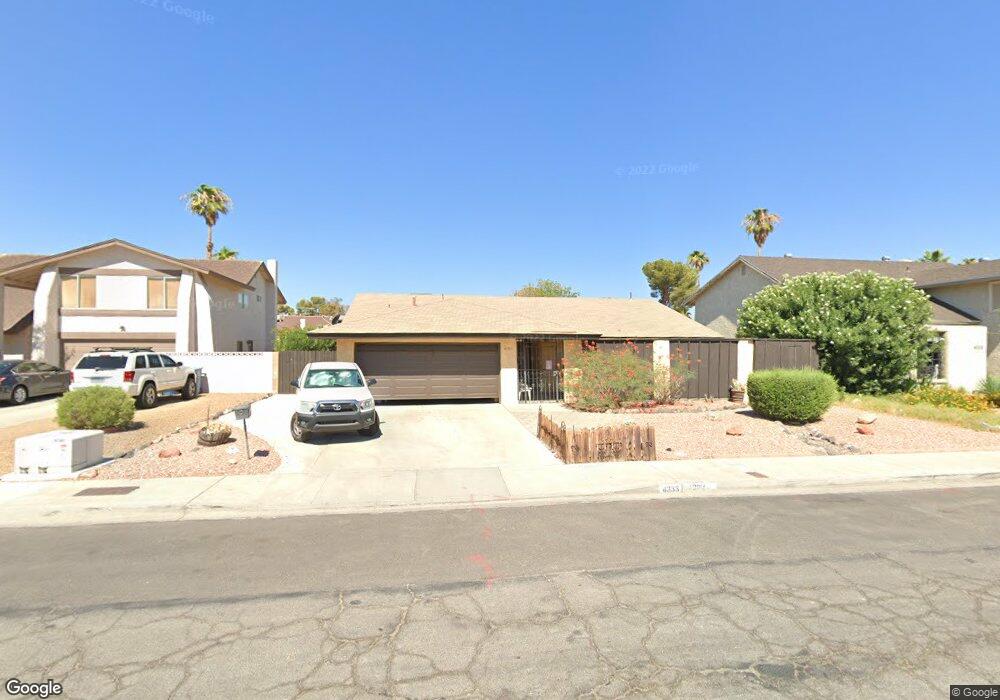
4333 Soria Way Las Vegas, NV 89121
Paradise Valley East NeighborhoodEstimated Value: $420,993 - $471,000
3
Beds
2
Baths
1,807
Sq Ft
$247/Sq Ft
Est. Value
About This Home
This home is located at 4333 Soria Way, Las Vegas, NV 89121 and is currently estimated at $445,498, approximately $246 per square foot. 4333 Soria Way is a home located in Clark County with nearby schools including William E. Ferron Elementary School, C.W. Woodbury Middle School, and Chaparral High School.
Ownership History
Date
Name
Owned For
Owner Type
Purchase Details
Closed on
Nov 29, 2013
Sold by
Carlsen Walter and Armstrong Sue
Bought by
Carlsen Walter
Current Estimated Value
Home Financials for this Owner
Home Financials are based on the most recent Mortgage that was taken out on this home.
Original Mortgage
$189,000
Outstanding Balance
$182,898
Interest Rate
4.04%
Mortgage Type
Reverse Mortgage Home Equity Conversion Mortgage
Estimated Equity
$262,600
Purchase Details
Closed on
May 19, 1995
Sold by
Carlsen Walter and Armstrong Sue
Bought by
Carlsen Walter and Armstrong Sue
Purchase Details
Closed on
Feb 9, 1994
Sold by
Carlsen Walter
Bought by
Carlsen Walter and Armstrong Sue
Home Financials for this Owner
Home Financials are based on the most recent Mortgage that was taken out on this home.
Original Mortgage
$93,500
Interest Rate
7.24%
Purchase Details
Closed on
Feb 8, 1994
Sold by
Mccutchen Noreen and Carlsen Noreen
Bought by
Carlsen Walter
Home Financials for this Owner
Home Financials are based on the most recent Mortgage that was taken out on this home.
Original Mortgage
$93,500
Interest Rate
7.24%
Create a Home Valuation Report for This Property
The Home Valuation Report is an in-depth analysis detailing your home's value as well as a comparison with similar homes in the area
Home Values in the Area
Average Home Value in this Area
Purchase History
| Date | Buyer | Sale Price | Title Company |
|---|---|---|---|
| Carlsen Walter | -- | None Available | |
| Carlsen Walter | -- | -- | |
| Carlsen Walter | $12,000 | Land Title | |
| Carlsen Walter | -- | -- |
Source: Public Records
Mortgage History
| Date | Status | Borrower | Loan Amount |
|---|---|---|---|
| Open | Carlsen Walter | $189,000 | |
| Previous Owner | Carlsen Walter | $93,500 |
Source: Public Records
Tax History Compared to Growth
Tax History
| Year | Tax Paid | Tax Assessment Tax Assessment Total Assessment is a certain percentage of the fair market value that is determined by local assessors to be the total taxable value of land and additions on the property. | Land | Improvement |
|---|---|---|---|---|
| 2025 | $1,175 | $65,082 | $31,150 | $33,932 |
| 2024 | $1,142 | $65,082 | $31,150 | $33,932 |
| 2023 | $1,142 | $70,805 | $36,750 | $34,055 |
| 2022 | $1,109 | $63,762 | $31,500 | $32,262 |
| 2021 | $1,076 | $57,428 | $25,900 | $31,528 |
| 2020 | $1,042 | $57,279 | $25,200 | $32,079 |
| 2019 | $1,012 | $55,479 | $23,100 | $32,379 |
| 2018 | $982 | $53,596 | $21,700 | $31,896 |
| 2017 | $1,504 | $51,277 | $18,200 | $33,077 |
| 2016 | $931 | $46,603 | $12,250 | $34,353 |
| 2015 | $928 | $44,081 | $10,500 | $33,581 |
| 2014 | $901 | $39,057 | $6,300 | $32,757 |
Source: Public Records
Map
Nearby Homes
- 4274 Gibraltar St
- 4356 Powell Ave
- 4458 El Quinta Ct
- 4165 Grace St
- 4278 El Campana Way
- 4269 Cartegena Way
- 4625 La Fonda Dr
- 4356 Sabadell St
- 4606 Powell Ave
- 4165 Santa Terrasa Place
- 4078 Gold Coast Dr
- 4072 Great Plains Way
- 4533 Charles Ronald Ave
- 4285 El Como Way
- 4300 Don Quixote St
- 4310 El Antonio Place
- 4765 Monterrey Ave
- 4813 Plata Del Sol Dr
- 4785 San Sebastian Ave
- 4231 White Sands Ave
- 4341 Soria Way
- 4325 Soria Way
- 4338 Seville St
- 4348 Seville St
- 4467 E Rochelle Ave
- 4459 E Rochelle Ave
- 4349 Soria Way
- 4328 Seville St
- 4358 Seville St
- 4326 Soria Way
- 4336 Soria Way
- 4318 Soria Way
- 4451 E Rochelle Ave
- 4344 Soria Way
- 4357 Soria Way
- 4310 Soria Way
- 4368 Seville St
- 4356 Soria Way
- 4445 E Rochelle Ave
- 4339 Salamanca Cir