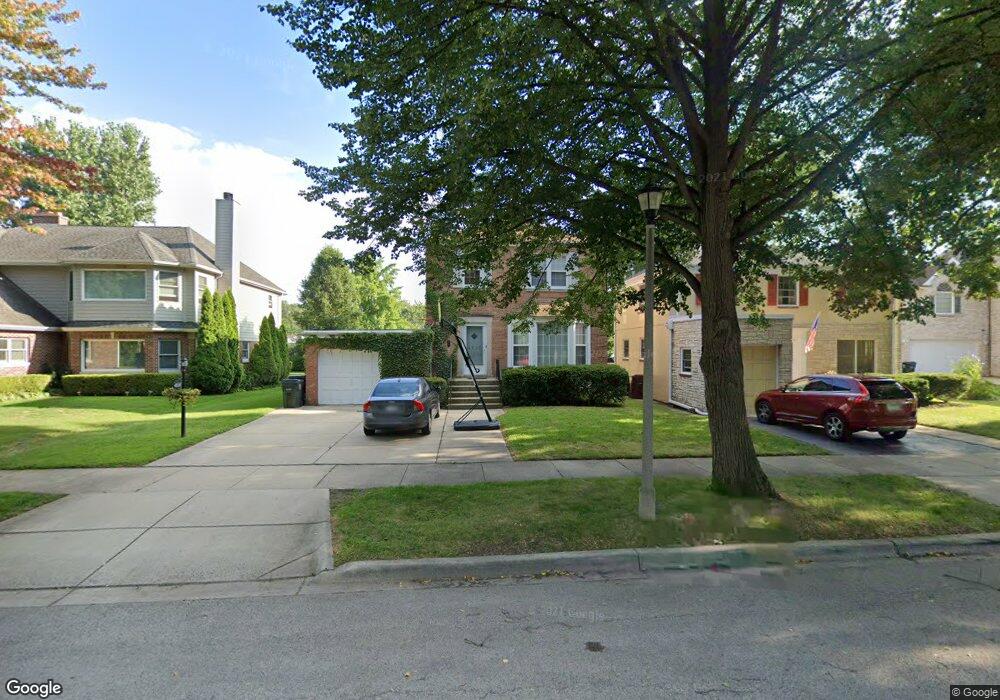
4335 Bobolink Terrace Skokie, IL 60076
North Skokie NeighborhoodEstimated Value: $528,000 - $611,000
3
Beds
2
Baths
1,562
Sq Ft
$359/Sq Ft
Est. Value
About This Home
This home is located at 4335 Bobolink Terrace, Skokie, IL 60076 and is currently estimated at $560,643, approximately $358 per square foot. 4335 Bobolink Terrace is a home located in Cook County with nearby schools including Elizabeth Meyer School, John Middleton Elementary School, and Oliver Mccracken Middle School.
Ownership History
Date
Name
Owned For
Owner Type
Purchase Details
Closed on
Apr 26, 2010
Sold by
Sonnier Stephen A and Sonnier Suzanne E
Bought by
Sonnier Suzanne E
Current Estimated Value
Purchase Details
Closed on
Aug 19, 2005
Sold by
Taranu Sanda
Bought by
Sonnier Stephen A and Sonnier Suzanne E
Home Financials for this Owner
Home Financials are based on the most recent Mortgage that was taken out on this home.
Original Mortgage
$359,650
Outstanding Balance
$192,196
Interest Rate
5.93%
Mortgage Type
Fannie Mae Freddie Mac
Estimated Equity
$368,447
Purchase Details
Closed on
Oct 28, 2004
Sold by
Stoops John J and Stoops Beverly N
Bought by
Taranu Sanda
Home Financials for this Owner
Home Financials are based on the most recent Mortgage that was taken out on this home.
Original Mortgage
$309,200
Interest Rate
7.35%
Mortgage Type
Unknown
Create a Home Valuation Report for This Property
The Home Valuation Report is an in-depth analysis detailing your home's value as well as a comparison with similar homes in the area
Home Values in the Area
Average Home Value in this Area
Purchase History
| Date | Buyer | Sale Price | Title Company |
|---|---|---|---|
| Sonnier Suzanne E | -- | None Available | |
| Sonnier Stephen A | $450,000 | First American Title Ins Co | |
| Taranu Sanda | $386,500 | Cti |
Source: Public Records
Mortgage History
| Date | Status | Borrower | Loan Amount |
|---|---|---|---|
| Open | Sonnier Stephen A | $359,650 | |
| Previous Owner | Taranu Sanda | $309,200 | |
| Closed | Taranu Sanda | $77,300 |
Source: Public Records
Tax History Compared to Growth
Tax History
| Year | Tax Paid | Tax Assessment Tax Assessment Total Assessment is a certain percentage of the fair market value that is determined by local assessors to be the total taxable value of land and additions on the property. | Land | Improvement |
|---|---|---|---|---|
| 2024 | $12,125 | $43,000 | $9,504 | $33,496 |
| 2023 | $11,909 | $43,000 | $9,504 | $33,496 |
| 2022 | $11,909 | $43,000 | $9,504 | $33,496 |
| 2021 | $10,182 | $31,682 | $6,534 | $25,148 |
| 2020 | $9,817 | $31,682 | $6,534 | $25,148 |
| 2019 | $10,058 | $36,259 | $6,534 | $29,725 |
| 2018 | $10,749 | $33,815 | $5,742 | $28,073 |
| 2017 | $10,827 | $33,815 | $5,742 | $28,073 |
| 2016 | $10,468 | $33,815 | $5,742 | $28,073 |
| 2015 | $10,736 | $31,965 | $4,950 | $27,015 |
| 2014 | $10,520 | $31,965 | $4,950 | $27,015 |
| 2013 | $10,454 | $31,965 | $4,950 | $27,015 |
Source: Public Records
Map
Nearby Homes
- 4410 Bobolink Terrace
- 4218 Main St
- 8318 Kilbourn Ave
- 7825 Kolmar Ave
- 8219 Lowell Ave
- 4454 Concord Ln
- 8449 Kedvale Ave
- 4643 Main St Unit 3C
- 8141 Kenneth Ave
- 8228 Kedvale Ave
- 4636 Washington St Unit 3S
- 8130 Kenneth Ave
- 8226 Kenton Ave
- 8301 Karlov Ave
- 4555 Cleveland St
- 8100 Lowell Ave
- 8414 Crawford Ave
- 8206 Knox Ave
- 4739 Washington St
- 8720 Karlov Ave
- 4341 Bobolink Terrace
- 4333 Bobolink Terrace
- 4321 Bobolink Terrace
- 4321 Bobolink Terrace
- 4349 Bobolink Terrace
- 4336 Main St
- 4340 Main St
- 4330 Main St
- 4342 Main St
- 4324 Main St
- 4346 Main St
- 4320 Main St
- 4334 Bobolink Terrace
- 8425 Kostner Ave
- 4342 Bobolink Terrace
- 4352 Main St
- 4316 Main St
- 4326 Bobolink Terrace
- 4311 Bobolink Terrace
- 4348 Bobolink Terrace