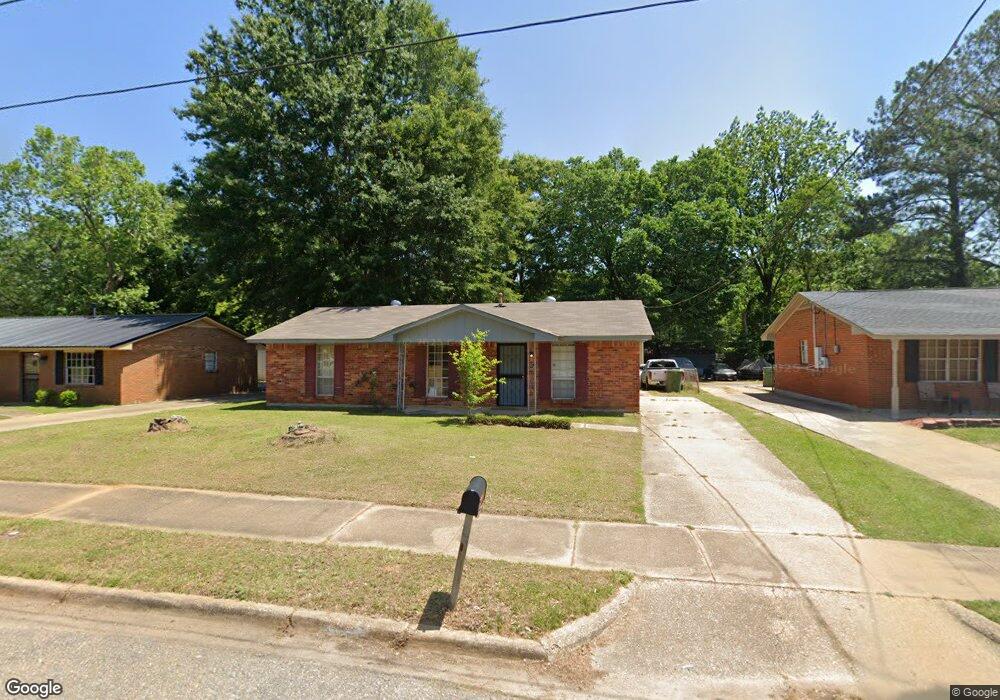
4335 Longleaf Dr Montgomery, AL 36108
Estimated Value: $70,000 - $78,000
3
Beds
2
Baths
1,144
Sq Ft
$65/Sq Ft
Est. Value
About This Home
This home is located at 4335 Longleaf Dr, Montgomery, AL 36108 and is currently estimated at $74,328, approximately $64 per square foot. 4335 Longleaf Dr is a home located in Montgomery County with nearby schools including Martin Luther King Elementary School, Southlawn Middle School, and Carver Senior High School.
Ownership History
Date
Name
Owned For
Owner Type
Purchase Details
Closed on
Nov 8, 2007
Sold by
Christiana Bank & Trust Co
Bought by
Buskey Julius and Buskey Ora
Current Estimated Value
Purchase Details
Closed on
Nov 9, 2006
Sold by
Gaskin Quinton and Scroggins Tammy
Bought by
Christiana Bank & Trust Co
Purchase Details
Closed on
Sep 29, 2003
Sold by
Wilmar Inc
Bought by
Gaskin Quinton and Scroggins Tammy
Home Financials for this Owner
Home Financials are based on the most recent Mortgage that was taken out on this home.
Original Mortgage
$46,325
Interest Rate
6.28%
Mortgage Type
Seller Take Back
Purchase Details
Closed on
Aug 19, 2003
Sold by
Canterberry Dewitt C and Canterberry Faye T
Bought by
Wilmar Inc
Home Financials for this Owner
Home Financials are based on the most recent Mortgage that was taken out on this home.
Original Mortgage
$46,325
Interest Rate
6.28%
Mortgage Type
Seller Take Back
Create a Home Valuation Report for This Property
The Home Valuation Report is an in-depth analysis detailing your home's value as well as a comparison with similar homes in the area
Purchase History
| Date | Buyer | Sale Price | Title Company |
|---|---|---|---|
| Buskey Julius | $30,000 | None Available | |
| Christiana Bank & Trust Co | $35,000 | None Available | |
| Gaskin Quinton | -- | -- | |
| Wilmar Inc | -- | -- |
Source: Public Records
Mortgage History
| Date | Status | Borrower | Loan Amount |
|---|---|---|---|
| Previous Owner | Gaskin Quinton | $46,325 | |
| Closed | Gaskin Quinton | $7,175 |
Source: Public Records
Tax History
| Year | Tax Paid | Tax Assessment Tax Assessment Total Assessment is a certain percentage of the fair market value that is determined by local assessors to be the total taxable value of land and additions on the property. | Land | Improvement |
|---|---|---|---|---|
| 2025 | $732 | $15,120 | $1,100 | $14,020 |
| 2024 | $685 | $14,000 | $1,100 | $12,900 |
| 2023 | $685 | $12,440 | $1,100 | $11,340 |
| 2022 | $354 | $9,700 | $1,100 | $8,600 |
| 2021 | $269 | $7,380 | $1,100 | $6,280 |
| 2020 | $269 | $7,380 | $1,100 | $6,280 |
| 2019 | $269 | $7,380 | $1,100 | $6,280 |
| 2018 | $292 | $8,000 | $0 | $0 |
| 2017 | $380 | $10,420 | $1,100 | $9,320 |
| 2014 | $420 | $11,502 | $1,100 | $10,402 |
| 2013 | -- | $11,080 | $1,100 | $9,980 |
Source: Public Records
Map
Nearby Homes
- 0 Old Hayneville Rd Unit 583386
- 4160 Piedmont Dr
- 4132 Piedmont Dr
- 4500 Sunnybrook Dr
- 4323 Sunnybrook Dr
- 815 Lamar Rd
- 0 Stehle Ln
- 3530 Zack Gordon Ln
- 0000 Hayneville Rd
- 0 West Blvd Unit 285977
- 4104 Lone Oak Dr
- 0 Patrick Rd Unit 11
- 0 Patrick Rd
- 303 Kingswood Rd
- 5253 Rolind Dr
- 322 Winderton Dr
- 326 Winderton Dr
- 5330 Connie Cir
- 423 Daman Dr
- 880 Wasden Rd
- 4339 Longleaf Dr
- 4331 Longleaf Dr
- 4343 Longleaf Dr
- 4352 Richardson Rd
- 4327 Longleaf Dr
- 4356 Richardson Rd
- 4348 Richardson Rd
- 4360 Richardson Rd
- 4334 Longleaf Dr
- 4330 Longleaf Dr
- 4344 Richardson Rd
- 4347 Longleaf Dr
- 4323 Longleaf Dr
- 4338 Longleaf Dr
- 4326 Longleaf Dr
- 4364 Richardson Rd
- 4342 Longleaf Dr
- 4340 Richardson Rd
- 4322 Longleaf Dr
- 4351 Longleaf Dr
Your Personal Tour Guide
Ask me questions while you tour the home.