Estimated Value: $395,000 - $434,000
4
Beds
3
Baths
2,005
Sq Ft
$204/Sq Ft
Est. Value
About This Home
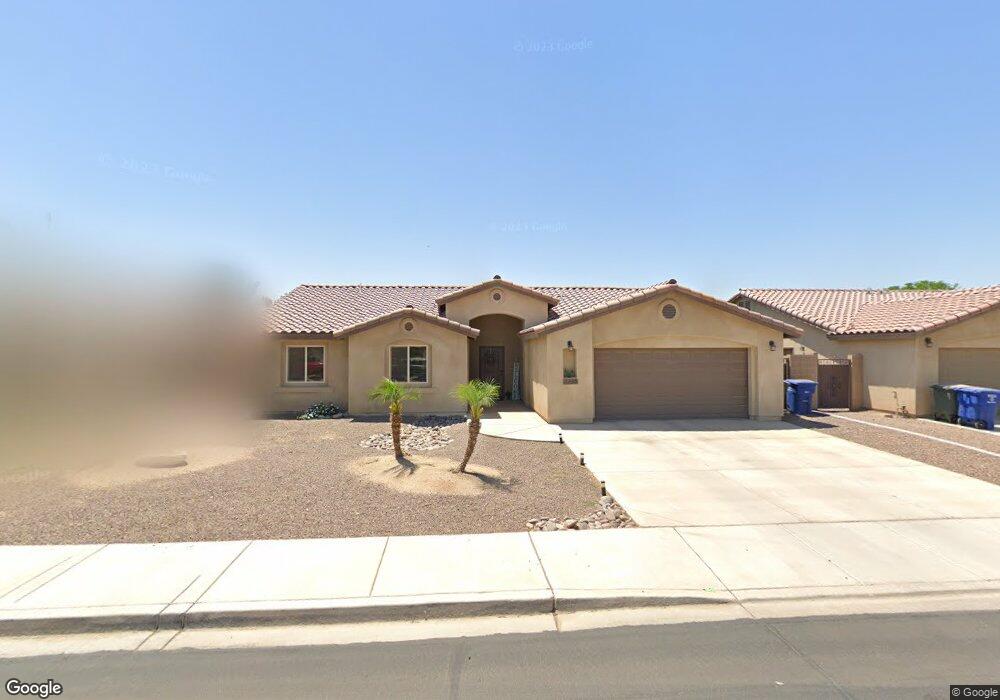
This home is located at 4335 W 12th Place, Yuma, AZ 85364 and is currently estimated at $409,572, approximately $204 per square foot. 4335 W 12th Place is a home located in Yuma County with nearby schools including H. L. Suverkrup Elementary School, Crane Middle School, and Cibola High School.
Ownership History
Date
Name
Owned For
Owner Type
Purchase Details
Closed on
Apr 22, 2020
Sold by
Walker Jonathan Vniliam and Walker Kelly Anne
Bought by
Hemandez Juan D
Current Estimated Value
Home Financials for this Owner
Home Financials are based on the most recent Mortgage that was taken out on this home.
Original Mortgage
$250,381
Outstanding Balance
$221,386
Interest Rate
3.3%
Mortgage Type
FHA
Estimated Equity
$188,186
Purchase Details
Closed on
Oct 12, 2015
Sold by
Valley 40 Llc
Bought by
Lynnwood Homes Ii Llc
Home Financials for this Owner
Home Financials are based on the most recent Mortgage that was taken out on this home.
Original Mortgage
$228,816
Interest Rate
3.87%
Mortgage Type
VA
Purchase Details
Closed on
Sep 29, 2015
Sold by
Lynnwood Homes Ii Llc
Bought by
Walker Jonathan William and Walker Kelly Anne
Home Financials for this Owner
Home Financials are based on the most recent Mortgage that was taken out on this home.
Original Mortgage
$228,816
Interest Rate
3.87%
Mortgage Type
VA
Create a Home Valuation Report for This Property
The Home Valuation Report is an in-depth analysis detailing your home's value as well as a comparison with similar homes in the area
Home Values in the Area
Average Home Value in this Area
Purchase History
| Date | Buyer | Sale Price | Title Company |
|---|---|---|---|
| Hemandez Juan D | $255,000 | Stewart Ttl & Tr Of Phoenix | |
| Lynnwood Homes Ii Llc | -- | Pioneer Title Agency Inc | |
| Walker Jonathan William | $224,000 | Pioneer Title Agency Inc |
Source: Public Records
Mortgage History
| Date | Status | Borrower | Loan Amount |
|---|---|---|---|
| Open | Hemandez Juan D | $250,381 | |
| Previous Owner | Walker Jonathan William | $228,816 |
Source: Public Records
Tax History Compared to Growth
Tax History
| Year | Tax Paid | Tax Assessment Tax Assessment Total Assessment is a certain percentage of the fair market value that is determined by local assessors to be the total taxable value of land and additions on the property. | Land | Improvement |
|---|---|---|---|---|
| 2025 | $2,832 | $26,577 | $4,369 | $22,208 |
| 2024 | $2,696 | $25,311 | $4,066 | $21,245 |
| 2023 | $2,696 | $24,106 | $4,291 | $19,815 |
| 2022 | $2,626 | $22,957 | $4,664 | $18,293 |
| 2021 | $2,768 | $21,865 | $4,498 | $17,367 |
| 2020 | $2,687 | $20,823 | $3,480 | $17,343 |
| 2019 | $2,642 | $19,832 | $3,325 | $16,507 |
| 2018 | $2,472 | $19,106 | $3,184 | $15,922 |
| 2017 | $2,422 | $19,106 | $3,184 | $15,922 |
| 2016 | $2,326 | $17,330 | $3,549 | $13,781 |
| 2015 | $520 | $3,656 | $3,656 | $0 |
| 2014 | $520 | $3,482 | $3,482 | $0 |
Source: Public Records
Map
Nearby Homes
- 4282 W 12th Place
- 1370 S 42nd Dr
- 4114 W 13th Place
- 1442 S 42nd Dr
- 4302 W 14th Ln
- 4447 W 14th Place
- 4108 W 14th St
- 4720 W Clip St
- 8324 S Coconino Ln
- 1570 S 46th Ave
- 1435 S Thomas Ave
- 4427 W 16th Place
- 1051 S 47th Ave
- 1653 S 42nd Ave
- 3705 W Crane St
- 3698 W 14th Place
- 4549 W 16th Ln
- 4332 W 17th Place
- 851 S Eleanor Ave
- 8692 S Mojave Ln
- 4335 W 12th Place
- 4321 W 12th Place
- 4336 W 12th Ln
- 4322 W 12th Ln
- 4352 W 12th Ln
- 4307 W 12th Place
- 4334 W 12th Place
- 4308 W 12th Ln
- 4368 W 12th Ln
- 4350 W 12th Place
- 4320 W 12th Place
- 4366 W 12th Place
- 4385 W 12th Place
- 4295 W 12th Place
- 4323 W 12th Ln
- 4306 W 12th Place
- 4296 W 12th Ln
- 4386 W 12th Ln
- 4337 W 12th Ln
- 4384 W 12th Place