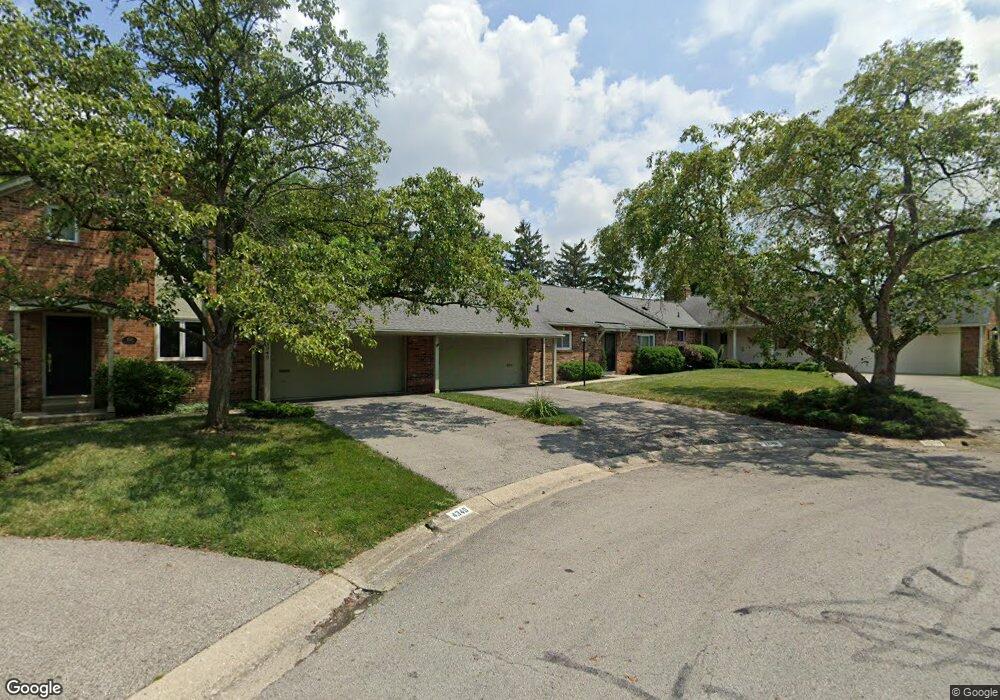
4336 Airendel Ct Unit C3 Columbus, OH 43220
Estimated Value: $295,032 - $389,000
2
Beds
2
Baths
1,224
Sq Ft
$283/Sq Ft
Est. Value
About This Home
This home is located at 4336 Airendel Ct Unit C3, Columbus, OH 43220 and is currently estimated at $346,258, approximately $282 per square foot. 4336 Airendel Ct Unit C3 is a home located in Franklin County with nearby schools including Greensview Elementary School, Hastings Middle School, and Upper Arlington High School.
Ownership History
Date
Name
Owned For
Owner Type
Purchase Details
Closed on
Aug 29, 2017
Sold by
Cummins Carol A
Bought by
Cummins Philip A
Current Estimated Value
Purchase Details
Closed on
May 18, 2005
Sold by
Kauffman Sarah D
Bought by
Cummins Carol A
Home Financials for this Owner
Home Financials are based on the most recent Mortgage that was taken out on this home.
Original Mortgage
$133,500
Interest Rate
6.05%
Mortgage Type
Purchase Money Mortgage
Purchase Details
Closed on
Oct 18, 2001
Sold by
Leverenz Evelyne V
Bought by
Kauffman Sarah D
Purchase Details
Closed on
Feb 3, 1993
Bought by
Leverenz Evelyne
Purchase Details
Closed on
Aug 1, 1979
Create a Home Valuation Report for This Property
The Home Valuation Report is an in-depth analysis detailing your home's value as well as a comparison with similar homes in the area
Home Values in the Area
Average Home Value in this Area
Purchase History
| Date | Buyer | Sale Price | Title Company |
|---|---|---|---|
| Cummins Philip A | -- | None Available | |
| Cummins Carol A | $166,900 | -- | |
| Kauffman Sarah D | $150,000 | -- | |
| Leverenz Evelyne | $108,000 | -- | |
| -- | $70,000 | -- |
Source: Public Records
Mortgage History
| Date | Status | Borrower | Loan Amount |
|---|---|---|---|
| Previous Owner | Cummins Carol A | $133,500 |
Source: Public Records
Tax History Compared to Growth
Tax History
| Year | Tax Paid | Tax Assessment Tax Assessment Total Assessment is a certain percentage of the fair market value that is determined by local assessors to be the total taxable value of land and additions on the property. | Land | Improvement |
|---|---|---|---|---|
| 2024 | $4,804 | $92,790 | $24,500 | $68,290 |
| 2023 | $4,781 | $92,785 | $24,500 | $68,285 |
| 2022 | $6,570 | $73,920 | $26,950 | $46,970 |
| 2021 | $4,031 | $73,920 | $26,950 | $46,970 |
| 2020 | $3,996 | $73,920 | $26,950 | $46,970 |
| 2019 | $4,053 | $67,200 | $24,500 | $42,700 |
| 2018 | $3,659 | $67,200 | $24,500 | $42,700 |
| 2017 | $3,656 | $67,200 | $24,500 | $42,700 |
| 2016 | $3,291 | $58,520 | $11,550 | $46,970 |
| 2015 | $3,288 | $58,520 | $11,550 | $46,970 |
| 2014 | $3,292 | $58,520 | $11,550 | $46,970 |
| 2013 | $1,544 | $53,200 | $10,500 | $42,700 |
Source: Public Records
Map
Nearby Homes
- 4326 Kenny Rd
- 4271 Kenbury Place
- 1033 Folkestone Rd
- 4160 Ruxton Ln
- 4543 Ducrest Dr
- 1512 Lafayette Dr Unit B
- 4710 Charecote Ln Unit D
- 1046 Merrimar Cir N Unit B
- 1030 Galliton Ct Unit B
- 1594 Lafayette Dr Unit 1594
- 1610 Lafayette Dr Unit 1610
- 713 Marburn Dr
- 1109 Millcreek Ln
- 1466 Weybridge Rd
- 4020 Ritamarie Dr
- 4924 Reed Rd Unit B
- 652 Olde Towne Ave Unit 9-652E
- 652 Olde Towne Ave Unit 9-652 G
- 1161 Bethel Rd Unit 103/104
- 1221 Bethel Rd
- 4332 Airendel Ct Unit C4
- 4340 Airendel Ct Unit C2
- 4344 Airendel Ct
- 4344 Airendel Ct Unit C-1
- 4331 Airendel Ct
- 4331 Airendel Ct Unit A-1
- 4335 Airendel Ct Unit A2
- 4339 Airendel Ct
- 4343 Airendel Ct
- 4343 Airendel Ct Unit A-4
- 4300 Chaucer Ln Unit 4300
- 4360 Airendel Ct Unit D1
- 4360 Airendel Ct Unit 1
- 1161 Airendel Ln
- 4296 Chaucer Ln
- 1165 Airendel Ln
- 4294 Chaucer Ln
- 4348 Kenny Rd
- 4301 Chaucer Ln
- 4336 Kenny Rd