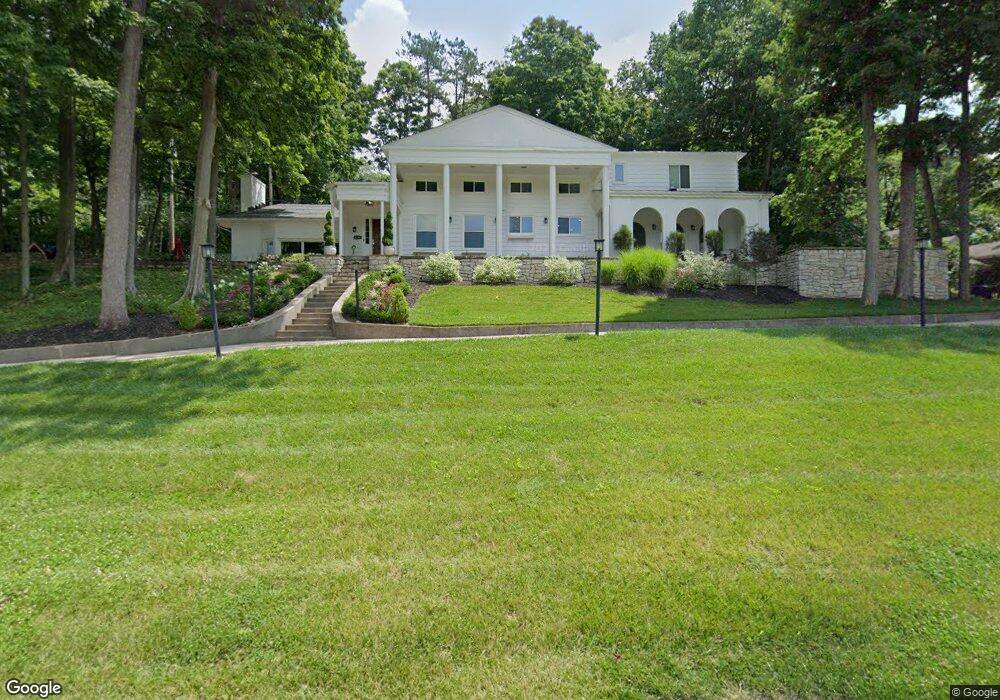
4336 Overland Trail Dayton, OH 45429
Estimated Value: $840,000 - $1,019,000
5
Beds
5
Baths
5,085
Sq Ft
$177/Sq Ft
Est. Value
About This Home
This home is located at 4336 Overland Trail, Dayton, OH 45429 and is currently estimated at $898,473, approximately $176 per square foot. 4336 Overland Trail is a home located in Montgomery County with nearby schools including Southdale Elementary School, Van Buren Middle School, and Kettering Fairmont High School.
Ownership History
Date
Name
Owned For
Owner Type
Purchase Details
Closed on
Aug 24, 2021
Sold by
Waker Ron
Bought by
Schloneger Mark R and Schloneger Melissa
Current Estimated Value
Home Financials for this Owner
Home Financials are based on the most recent Mortgage that was taken out on this home.
Original Mortgage
$519,200
Outstanding Balance
$471,402
Interest Rate
2.8%
Mortgage Type
New Conventional
Estimated Equity
$427,071
Purchase Details
Closed on
Mar 8, 2018
Sold by
Jpmorgan Chase Bank N A
Bought by
Waker Ron
Purchase Details
Closed on
Jan 8, 2018
Sold by
Madewell Nancy J
Bought by
Jpmorgan Chase Bank N A
Purchase Details
Closed on
Nov 10, 2017
Sold by
Madewell Nancy J
Bought by
Jpmorgan Chase Bank N A
Purchase Details
Closed on
Jul 30, 1999
Sold by
Moore Andrew J and Moore Vera E
Bought by
Madewell Nancy J
Home Financials for this Owner
Home Financials are based on the most recent Mortgage that was taken out on this home.
Original Mortgage
$323,600
Interest Rate
7.75%
Mortgage Type
Purchase Money Mortgage
Create a Home Valuation Report for This Property
The Home Valuation Report is an in-depth analysis detailing your home's value as well as a comparison with similar homes in the area
Home Values in the Area
Average Home Value in this Area
Purchase History
| Date | Buyer | Sale Price | Title Company |
|---|---|---|---|
| Schloneger Mark R | $649,000 | Landmark Ttl Agcy South Inc | |
| Waker Ron | $180,000 | First Central Land Title Age | |
| Jpmorgan Chase Bank N A | $198,000 | None Available | |
| Jpmorgan Chase Bank N A | $198,000 | None Available | |
| Madewell Nancy J | $404,500 | -- |
Source: Public Records
Mortgage History
| Date | Status | Borrower | Loan Amount |
|---|---|---|---|
| Open | Schloneger Mark R | $519,200 | |
| Previous Owner | Madewell Nancy J | $323,600 |
Source: Public Records
Tax History Compared to Growth
Tax History
| Year | Tax Paid | Tax Assessment Tax Assessment Total Assessment is a certain percentage of the fair market value that is determined by local assessors to be the total taxable value of land and additions on the property. | Land | Improvement |
|---|---|---|---|---|
| 2024 | $19,570 | $316,810 | $27,440 | $289,370 |
| 2023 | $19,570 | $316,810 | $27,440 | $289,370 |
| 2022 | $19,330 | $247,510 | $21,440 | $226,070 |
| 2021 | $17,871 | $247,510 | $21,440 | $226,070 |
| 2020 | $4,996 | $67,260 | $20,420 | $46,840 |
| 2019 | $5,646 | $67,260 | $20,420 | $46,840 |
| 2018 | $5,556 | $67,260 | $20,420 | $46,840 |
| 2017 | $13,353 | $152,920 | $20,420 | $132,500 |
| 2016 | $10,698 | $132,540 | $20,420 | $112,120 |
| 2015 | $10,506 | $132,540 | $20,420 | $112,120 |
| 2014 | $10,506 | $132,540 | $20,420 | $112,120 |
| 2012 | -- | $145,580 | $20,750 | $124,830 |
Source: Public Records
Map
Nearby Homes
- 298 Marchester Dr
- 4241 Schrubb Dr
- 3993 Applewood Ln
- 209 Westhaven Dr
- 4951 Walnut Walk
- 4400 Royal Ridge Way
- 5095 Wheaton St
- 309 Henrich Dr
- 5303 Split Rail
- 115 N Bromfield Rd
- 3325 Ridgeway Rd
- 4259 Maxlin Rd
- 215 Colonial Ln
- 4824 Far Hills Ave
- 4808 Judith Dr
- 4816 Judith Dr
- 5290 Wheaton St
- 604 Schuyler Dr
- 101 Enid Ave
- 3212 Lenox Dr
- 4340 Overland Trail
- 411 Shady Crest Dr
- 4318 Overland Trail
- 412 Shady Crest Dr
- 4331 Overland Trail
- 4300 Overland Trail
- 4370 Overland Trail
- 4309 Overland Trail
- 4321 Overland Trail
- 401 Shady Crest Dr
- 4351 Overland Trail
- 400 Shady Crest Dr
- 4311 Lotz Rd
- 412 Marchester Dr
- 507 Elderwood Rd
- 4287 Overland Trail
- 4390 Overland Trail
- 4421 Lotz Rd
- 400 Marchester Dr
- 4338 Trails End Dr