Estimated Value: $396,000 - $434,000
4
Beds
2
Baths
2,300
Sq Ft
$179/Sq Ft
Est. Value
About This Home
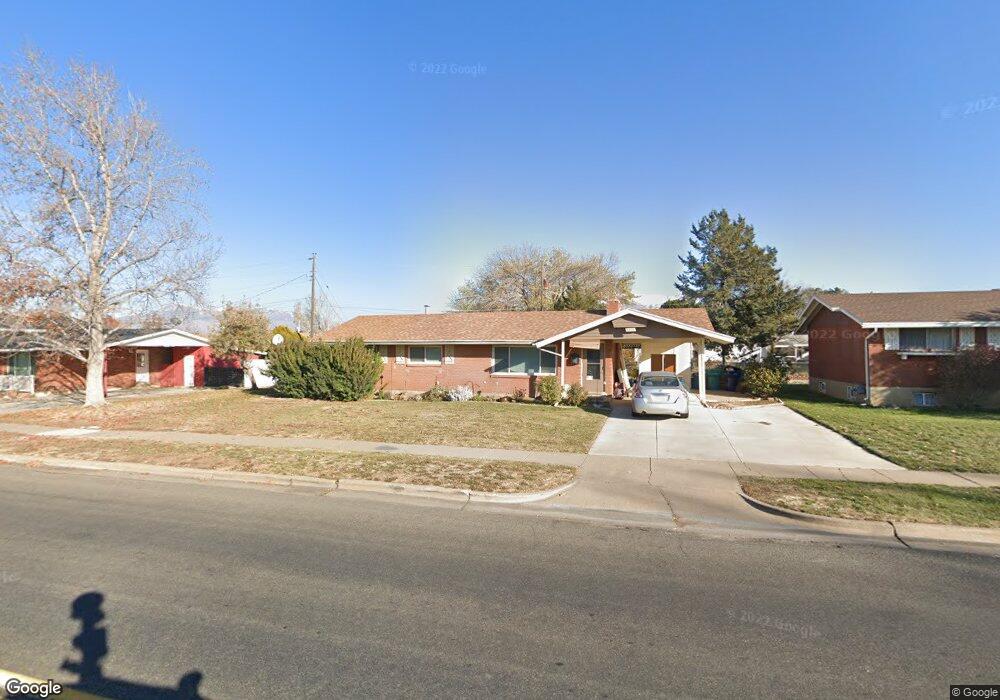
This home is located at 4336 S 2175 W, Roy, UT 84067 and is currently estimated at $411,912, approximately $179 per square foot. 4336 S 2175 W is a home located in Weber County with nearby schools including North Park School, Sand Ridge Junior High School, and Roy High School.
Ownership History
Date
Name
Owned For
Owner Type
Purchase Details
Closed on
Sep 8, 2022
Sold by
Carter Joanne
Bought by
Carter Craig Matthew and Carter Joanne B
Current Estimated Value
Home Financials for this Owner
Home Financials are based on the most recent Mortgage that was taken out on this home.
Original Mortgage
$252,000
Outstanding Balance
$240,517
Interest Rate
5.3%
Mortgage Type
New Conventional
Estimated Equity
$171,395
Purchase Details
Closed on
Dec 27, 2018
Sold by
Crockett Katsuyo N and Crockett Joint Revocable Trust
Bought by
Carter Joanne and Bouwhuis Jon Edwin
Home Financials for this Owner
Home Financials are based on the most recent Mortgage that was taken out on this home.
Original Mortgage
$207,324
Interest Rate
4.9%
Mortgage Type
FHA
Purchase Details
Closed on
Feb 25, 2005
Sold by
Crockett Clark E and Crockett Katsuyo N
Bought by
Crockett Clark E and Crockett Katsuyo N
Create a Home Valuation Report for This Property
The Home Valuation Report is an in-depth analysis detailing your home's value as well as a comparison with similar homes in the area
Home Values in the Area
Average Home Value in this Area
Purchase History
| Date | Buyer | Sale Price | Title Company |
|---|---|---|---|
| Carter Craig Matthew | -- | First American Title | |
| Carter Joanne | -- | Stewart Title Ins Agcy Of | |
| Crockett Clark E | -- | -- |
Source: Public Records
Mortgage History
| Date | Status | Borrower | Loan Amount |
|---|---|---|---|
| Open | Carter Craig Matthew | $252,000 | |
| Previous Owner | Carter Joanne | $207,324 |
Source: Public Records
Tax History Compared to Growth
Tax History
| Year | Tax Paid | Tax Assessment Tax Assessment Total Assessment is a certain percentage of the fair market value that is determined by local assessors to be the total taxable value of land and additions on the property. | Land | Improvement |
|---|---|---|---|---|
| 2025 | $2,496 | $393,571 | $123,559 | $270,012 |
| 2024 | $2,437 | $212,849 | $67,965 | $144,884 |
| 2023 | $2,363 | $206,800 | $62,578 | $144,222 |
| 2022 | $2,346 | $211,200 | $54,616 | $156,584 |
| 2021 | $1,937 | $286,000 | $69,380 | $216,620 |
| 2020 | $1,822 | $247,000 | $69,380 | $177,620 |
| 2019 | $1,764 | $225,000 | $40,048 | $184,952 |
| 2018 | $862 | $197,000 | $37,028 | $159,972 |
| 2017 | $828 | $175,000 | $37,028 | $137,972 |
| 2016 | $730 | $83,844 | $17,771 | $66,073 |
| 2015 | $671 | $79,977 | $17,771 | $62,206 |
| 2014 | $680 | $79,977 | $17,771 | $62,206 |
Source: Public Records
Map
Nearby Homes
- 4328 S 2175 W
- 2263 W 4400 S
- 2082 W 4450 S
- 4220 S 2075 W
- 4205 S 2075 W
- 2015 W 4225 S
- 4475 S 1975 W
- 4110 S 2275 W
- 4073 S 2175 W
- 2259 W 4525 S
- 4164 S 2400 W
- 2038 W 4600 S
- 2070 W 4000 S
- 1825 W 4400 S
- 2050 W 4000 S
- 4536 S 1900 W Unit 12
- 3965 S 2225 W
- 4642 S 1900 W Unit 41
- 1959 3985 St S Unit 2
- 2096 W 3950 S