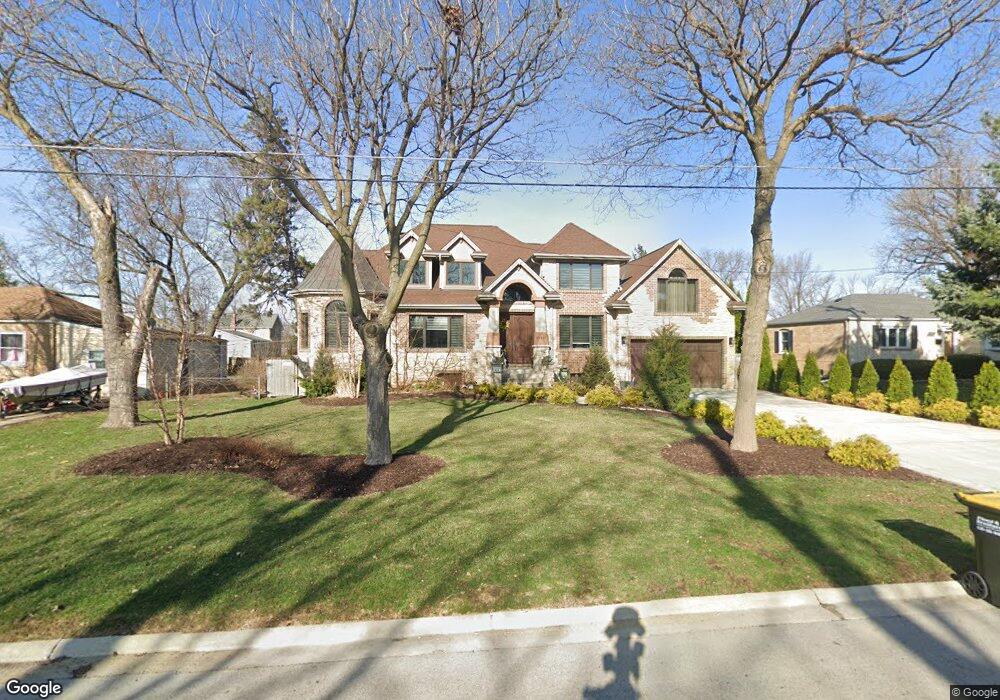
4336 Scott St Schiller Park, IL 60176
Estimated Value: $524,000 - $644,617
4
Beds
3
Baths
2,615
Sq Ft
$216/Sq Ft
Est. Value
About This Home
This home is located at 4336 Scott St, Schiller Park, IL 60176 and is currently estimated at $565,654, approximately $216 per square foot. 4336 Scott St is a home with nearby schools including John F Kennedy Elementary School, Washington Elementary School, and Lincoln Middle School.
Ownership History
Date
Name
Owned For
Owner Type
Purchase Details
Closed on
Jun 9, 2006
Sold by
Starzynski Maria B
Bought by
Burek Leszek and Kawa Burek Anetta
Current Estimated Value
Home Financials for this Owner
Home Financials are based on the most recent Mortgage that was taken out on this home.
Original Mortgage
$30,600
Outstanding Balance
$18,141
Interest Rate
6.72%
Mortgage Type
Credit Line Revolving
Estimated Equity
$547,513
Purchase Details
Closed on
Feb 27, 2006
Sold by
Cook Gregory Gerald and Cook Jennifer L
Bought by
Starzynski Maria B
Home Financials for this Owner
Home Financials are based on the most recent Mortgage that was taken out on this home.
Original Mortgage
$28,500
Interest Rate
6.22%
Mortgage Type
Stand Alone Second
Create a Home Valuation Report for This Property
The Home Valuation Report is an in-depth analysis detailing your home's value as well as a comparison with similar homes in the area
Home Values in the Area
Average Home Value in this Area
Purchase History
| Date | Buyer | Sale Price | Title Company |
|---|---|---|---|
| Burek Leszek | $306,000 | -- | |
| Starzynski Maria B | $285,000 | Multiple |
Source: Public Records
Mortgage History
| Date | Status | Borrower | Loan Amount |
|---|---|---|---|
| Open | Burek Leszek | $30,600 | |
| Open | Burek Leszek | $244,800 | |
| Previous Owner | Starzynski Maria B | $28,500 | |
| Previous Owner | Starzynski Maria B | $228,000 |
Source: Public Records
Tax History Compared to Growth
Tax History
| Year | Tax Paid | Tax Assessment Tax Assessment Total Assessment is a certain percentage of the fair market value that is determined by local assessors to be the total taxable value of land and additions on the property. | Land | Improvement |
|---|---|---|---|---|
| 2024 | $14,387 | $48,000 | $9,288 | $38,712 |
| 2023 | $14,350 | $48,000 | $9,288 | $38,712 |
| 2022 | $14,350 | $48,000 | $9,288 | $38,712 |
| 2021 | $12,131 | $34,974 | $6,708 | $28,266 |
| 2020 | $11,698 | $34,974 | $6,708 | $28,266 |
| 2019 | $11,340 | $39,430 | $6,708 | $32,722 |
| 2018 | $10,241 | $32,120 | $5,676 | $26,444 |
| 2017 | $10,236 | $32,120 | $5,676 | $26,444 |
| 2016 | $9,922 | $32,120 | $5,676 | $26,444 |
| 2015 | $9,720 | $29,858 | $5,160 | $24,698 |
| 2014 | $3,395 | $10,099 | $5,160 | $4,939 |
| 2013 | $2,517 | $7,629 | $5,160 | $2,469 |
Source: Public Records
Map
Nearby Homes
- 4305 Judd Ave
- 10004 Agatite Ave
- 9858 Montrose Ave
- 9912 Irving Park Rd
- 9945 Sunnyside Ave
- 4348 Ruby St
- 4228 Atlantic Ave
- 4034 Denley Ave
- 4012 Wagner Ave
- 4008 Wagner Ave
- 4438 Wesley Terrace
- 4608 Wesley Terrace
- 4816 Michigan Ave
- 9770 Ivanhoe Ave
- 9740 Linn Ave
- 9355 Irving Park Rd Unit 522
- 9514 Lawrence Ave Unit 2105
- 9514 Lawrence Ave Unit 2106
- 9514 Lawrence Ave Unit 2204
- 3709 Emerson St