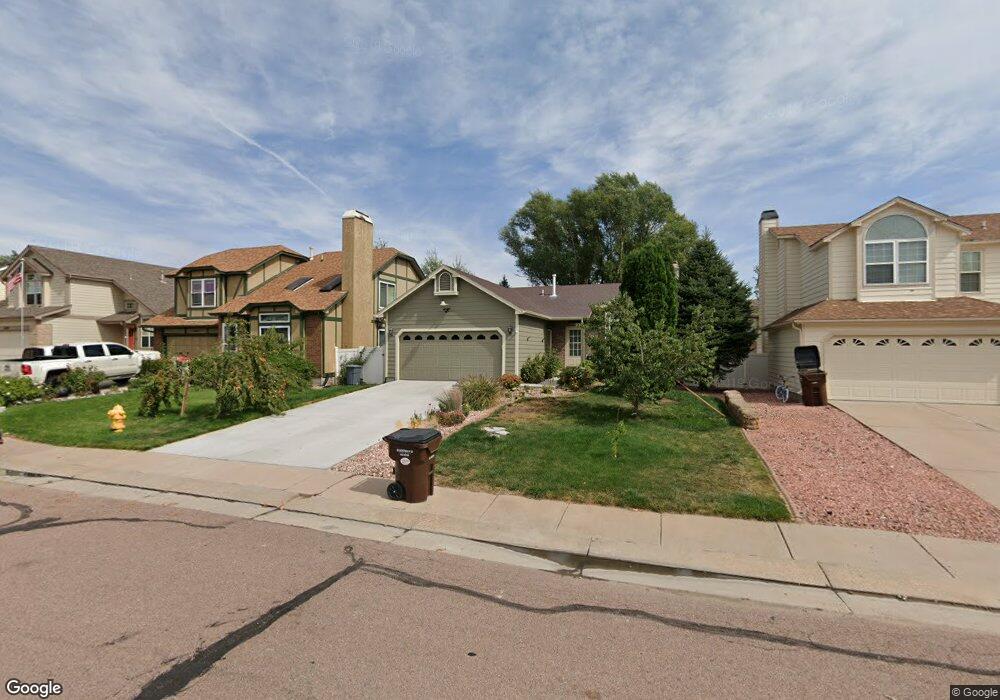
4337 Horizonpoint Dr Colorado Springs, CO 80925
Colorado Centre NeighborhoodEstimated Value: $344,000 - $369,359
3
Beds
2
Baths
918
Sq Ft
$384/Sq Ft
Est. Value
About This Home
This home is located at 4337 Horizonpoint Dr, Colorado Springs, CO 80925 and is currently estimated at $352,590, approximately $384 per square foot. 4337 Horizonpoint Dr is a home located in El Paso County with nearby schools including Martin Luther King Jr. Elementary School, Watson Junior High School, and Widefield High School.
Ownership History
Date
Name
Owned For
Owner Type
Purchase Details
Closed on
Jan 12, 2001
Sold by
Wood Rory E and Wood Dawn R
Bought by
Spah Robert J
Current Estimated Value
Home Financials for this Owner
Home Financials are based on the most recent Mortgage that was taken out on this home.
Original Mortgage
$108,000
Outstanding Balance
$40,108
Interest Rate
7.63%
Estimated Equity
$312,482
Purchase Details
Closed on
Sep 28, 1995
Sold by
Kenealy Francis Jerome and Kenealy Margaret Lea
Bought by
Wood Rory E and Wood Dawn R
Home Financials for this Owner
Home Financials are based on the most recent Mortgage that was taken out on this home.
Original Mortgage
$90,250
Interest Rate
7.84%
Purchase Details
Closed on
Sep 22, 1993
Bought by
Spah Robert J
Purchase Details
Closed on
Jun 16, 1988
Bought by
Spah Robert J
Purchase Details
Closed on
May 27, 1987
Bought by
Spah Robert J
Create a Home Valuation Report for This Property
The Home Valuation Report is an in-depth analysis detailing your home's value as well as a comparison with similar homes in the area
Home Values in the Area
Average Home Value in this Area
Purchase History
| Date | Buyer | Sale Price | Title Company |
|---|---|---|---|
| Spah Robert J | $120,000 | North American Title Co | |
| Wood Rory E | $95,000 | First American Title | |
| Spah Robert J | $73,000 | -- | |
| Spah Robert J | -- | -- | |
| Spah Robert J | -- | -- |
Source: Public Records
Mortgage History
| Date | Status | Borrower | Loan Amount |
|---|---|---|---|
| Open | Spah Robert J | $108,000 | |
| Previous Owner | Wood Rory E | $90,250 |
Source: Public Records
Tax History Compared to Growth
Tax History
| Year | Tax Paid | Tax Assessment Tax Assessment Total Assessment is a certain percentage of the fair market value that is determined by local assessors to be the total taxable value of land and additions on the property. | Land | Improvement |
|---|---|---|---|---|
| 2025 | $1,707 | $24,530 | -- | -- |
| 2024 | $1,572 | $25,200 | $5,090 | $20,110 |
| 2023 | $1,572 | $25,200 | $5,090 | $20,110 |
| 2022 | $1,431 | $18,480 | $3,500 | $14,980 |
| 2021 | $1,541 | $19,010 | $3,600 | $15,410 |
| 2020 | $1,402 | $15,780 | $3,150 | $12,630 |
| 2019 | $1,395 | $15,780 | $3,150 | $12,630 |
| 2018 | $1,203 | $12,890 | $2,020 | $10,870 |
| 2017 | $1,215 | $12,890 | $2,020 | $10,870 |
| 2016 | $960 | $12,220 | $1,990 | $10,230 |
| 2015 | $982 | $12,220 | $1,990 | $10,230 |
| 2014 | $896 | $11,230 | $1,990 | $9,240 |
Source: Public Records
Map
Nearby Homes
- 9208 Granger Ln
- 4421 Horizonpoint Dr
- 4332 Levi Ln
- 4404 Bramble Ln
- 4380 Gunbarrel Dr
- 4386 Gunbarrel Dr
- 4512 Bramble Ln
- 4548 Bramble Ln
- 9328 Chieftan Dr
- 9558 Yukon Way
- 9384 Pony Gulch Way
- 4555 Settlement Way
- 9630 Yukon Way
- Arcadia Plan at Meadoworks - Trinity Series
- Canyon Plan at Meadoworks - Yellowstone Series
- Enclave Plan at Meadoworks - Trinity Series
- Sancerre Plan at Meadoworks - Provence Series
- Creekside Plan at Meadoworks - Yellowstone Series
- Hayden Plan at Meadoworks - Yellowstone Series
- St Tropez Plan at Meadoworks - Provence Series
- 4333 Horizonpoint Dr
- 4341 Horizonpoint Dr
- 4329 Horizonpoint Dr
- 4425 Horizonpoint Dr
- 9225 Amble Ct
- 4325 Horizonpoint Dr
- 4325 Horizonpoint Dr
- 9221 Amble Ct
- 4336 Horizonpoint Dr
- 4332 Horizonpoint Dr
- 9229 Amble Ct
- 4340 Horizonpoint Dr
- 4429 Horizonpoint Dr
- 4328 Horizonpoint Dr
- 4321 Horizonpoint Dr
- 4404 Horizonpoint Dr
- 4420 Horizonpoint Dr
- 4416 Horizonpoint Dr
- 4424 Horizonpoint Dr
- 4336 Levi Ln