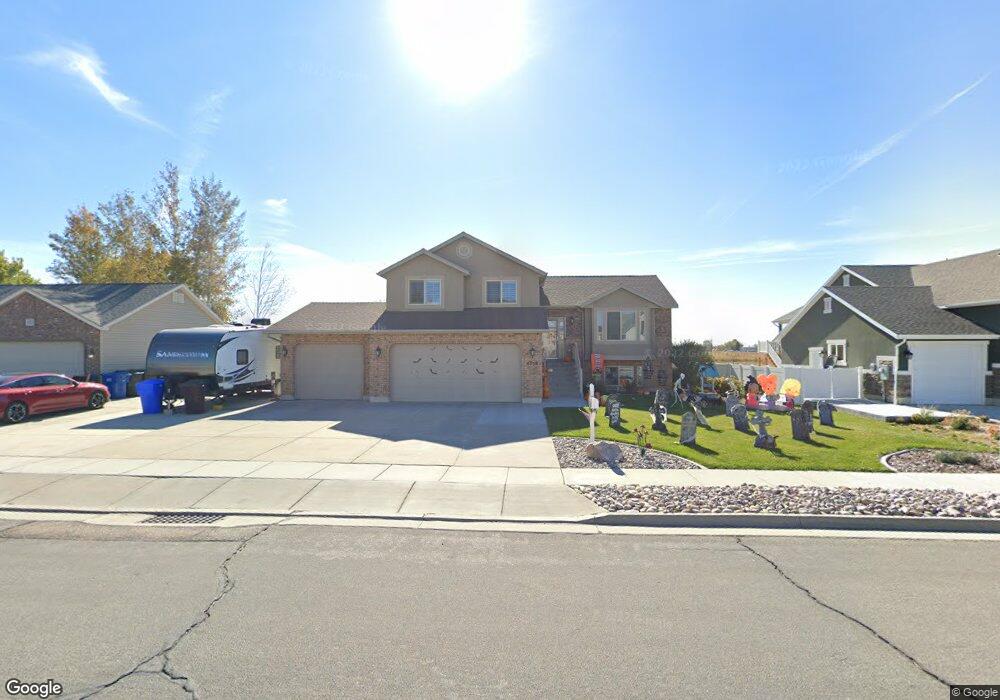
4339 W 25 S West Point, UT 84015
Estimated Value: $574,000 - $634,000
3
Beds
3
Baths
2,473
Sq Ft
$243/Sq Ft
Est. Value
About This Home
This home is located at 4339 W 25 S, West Point, UT 84015 and is currently estimated at $601,045, approximately $243 per square foot. 4339 W 25 S is a home located in Davis County with nearby schools including West Point School, West Point Junior High School, and Syracuse High School.
Ownership History
Date
Name
Owned For
Owner Type
Purchase Details
Closed on
Mar 13, 2013
Sold by
Marple Glen L and Marple Nancy A
Bought by
Marple Glen L and Marple Nancy A
Current Estimated Value
Purchase Details
Closed on
Oct 13, 2006
Sold by
Caldwell Nicholas and Caldwell Mindy
Bought by
Marple Glen L and Marple Nancy A
Home Financials for this Owner
Home Financials are based on the most recent Mortgage that was taken out on this home.
Original Mortgage
$230,000
Outstanding Balance
$136,385
Interest Rate
6.44%
Mortgage Type
VA
Estimated Equity
$464,660
Purchase Details
Closed on
May 11, 2005
Sold by
Ron Nelson & Sons Construction Inc
Bought by
Caldwell Nicholas and Caldwell Mindy
Home Financials for this Owner
Home Financials are based on the most recent Mortgage that was taken out on this home.
Original Mortgage
$144,000
Interest Rate
5.87%
Mortgage Type
New Conventional
Purchase Details
Closed on
Jan 3, 2005
Sold by
Out West Developers Llc
Bought by
Ron Nelson & Sons Construction Inc
Create a Home Valuation Report for This Property
The Home Valuation Report is an in-depth analysis detailing your home's value as well as a comparison with similar homes in the area
Home Values in the Area
Average Home Value in this Area
Purchase History
| Date | Buyer | Sale Price | Title Company |
|---|---|---|---|
| Marple Glen L | -- | None Available | |
| Marple Glen L | -- | Heritage West Title Ins Agen | |
| Caldwell Nicholas | -- | Heritage West Title Ins Agen | |
| Ron Nelson & Sons Construction Inc | -- | None Available |
Source: Public Records
Mortgage History
| Date | Status | Borrower | Loan Amount |
|---|---|---|---|
| Open | Marple Glen L | $230,000 | |
| Previous Owner | Caldwell Nicholas | $144,000 |
Source: Public Records
Tax History Compared to Growth
Tax History
| Year | Tax Paid | Tax Assessment Tax Assessment Total Assessment is a certain percentage of the fair market value that is determined by local assessors to be the total taxable value of land and additions on the property. | Land | Improvement |
|---|---|---|---|---|
| 2025 | -- | $276,650 | $123,109 | $153,541 |
| 2024 | -- | $281,050 | $110,780 | $170,270 |
| 2023 | $1,189 | $477,000 | $141,405 | $335,595 |
| 2022 | $1,189 | $281,050 | $74,497 | $206,553 |
| 2021 | $548 | $377,000 | $112,779 | $264,221 |
| 2020 | $274 | $334,000 | $95,396 | $238,604 |
| 2019 | $127 | $308,000 | $92,358 | $215,642 |
| 2018 | $30 | $288,000 | $90,937 | $197,063 |
| 2016 | $1,886 | $131,450 | $35,248 | $96,202 |
| 2015 | $1,866 | $123,255 | $35,248 | $88,007 |
| 2014 | $1,719 | $114,946 | $35,248 | $79,698 |
| 2013 | $1,813 | $114,990 | $31,094 | $83,896 |
Source: Public Records
Map
Nearby Homes
- 4325 W 75 N
- 4362 West St Unit 106
- 4358 West St Unit 105
- 120 N 4325 W
- 128 N 4500 W
- 4366 W 200 N
- 4594 W 75 N Unit 405
- 4352 W 300 N
- 4669 W 75 N
- 356 S 4300 W Unit 611
- 364 S 4300 W Unit 610
- 357 N 4000 W
- 3949 W 250 N
- 477 N 4500 W
- 3851 W 50 S Unit 425
- 3849 W 50 S Unit 426
- 3847 W 50 S Unit 428
- 3833 W 50 S Unit 429
- 3827 W 50 S Unit 431
- 9 S 3830 W Unit 441