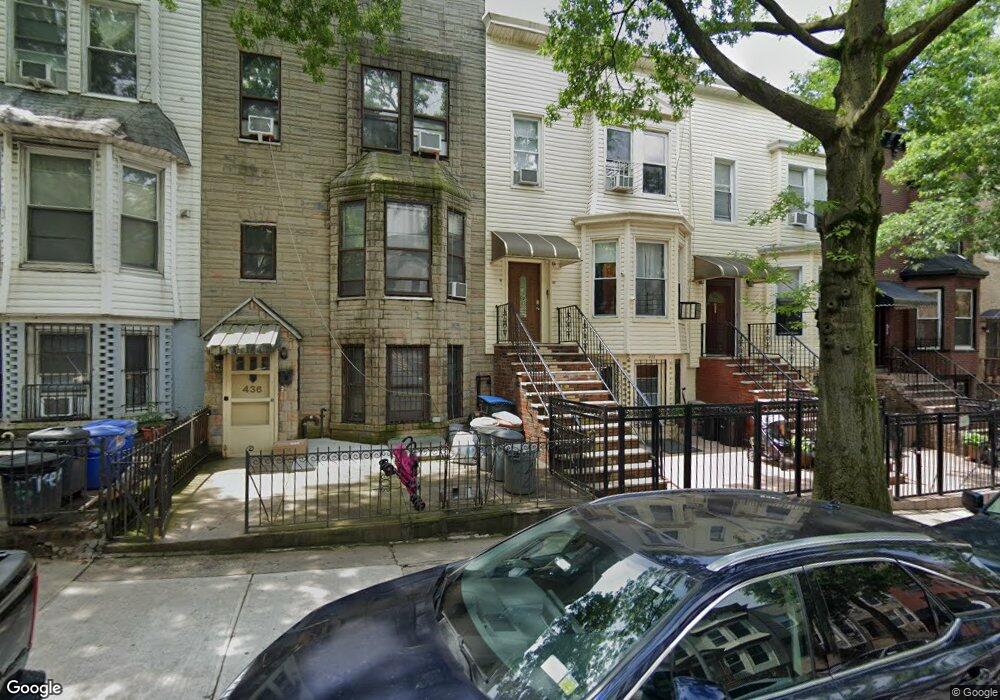
434 44th St Brooklyn, NY 11220
Sunset Park NeighborhoodEstimated Value: $1,154,889 - $1,652,000
--
Bed
--
Bath
2,648
Sq Ft
$528/Sq Ft
Est. Value
About This Home
This home is located at 434 44th St, Brooklyn, NY 11220 and is currently estimated at $1,396,972, approximately $527 per square foot. 434 44th St is a home located in Kings County with nearby schools including Sunset Park Avenue Elementary School, Leep Dual Language Academy Charter School, and Tomer Devorah High School for Girls.
Ownership History
Date
Name
Owned For
Owner Type
Purchase Details
Closed on
Dec 18, 2020
Sold by
Lewis Holly
Bought by
Lewis Holly and Lewis Lucille
Current Estimated Value
Purchase Details
Closed on
Apr 11, 2006
Sold by
Lewis Holly and Lewis Michele
Bought by
Lewis Holly
Purchase Details
Closed on
Aug 10, 2005
Sold by
Lewis Lucille and Lewis Moses
Bought by
Lewis Holly and Lewis Michelle
Create a Home Valuation Report for This Property
The Home Valuation Report is an in-depth analysis detailing your home's value as well as a comparison with similar homes in the area
Home Values in the Area
Average Home Value in this Area
Purchase History
| Date | Buyer | Sale Price | Title Company |
|---|---|---|---|
| Lewis Holly | -- | -- | |
| Lewis Holly | -- | -- | |
| Lewis Holly | -- | -- | |
| Lewis Holly | -- | -- | |
| Lewis Holly | -- | -- | |
| Lewis Holly | -- | -- |
Source: Public Records
Tax History Compared to Growth
Tax History
| Year | Tax Paid | Tax Assessment Tax Assessment Total Assessment is a certain percentage of the fair market value that is determined by local assessors to be the total taxable value of land and additions on the property. | Land | Improvement |
|---|---|---|---|---|
| 2025 | $5,354 | $63,720 | $16,380 | $47,340 |
| 2024 | $5,354 | $74,940 | $16,380 | $58,560 |
| 2023 | $959 | $89,040 | $16,380 | $72,660 |
| 2022 | $4,767 | $80,580 | $16,380 | $64,200 |
| 2021 | $297 | $71,880 | $16,380 | $55,500 |
| 2020 | $333 | $74,280 | $16,380 | $57,900 |
| 2019 | $4,647 | $75,480 | $16,380 | $59,100 |
| 2018 | $4,309 | $21,139 | $5,363 | $15,776 |
| 2017 | $4,309 | $21,139 | $5,470 | $15,669 |
| 2016 | $4,154 | $20,780 | $5,753 | $15,027 |
| 2015 | $2,185 | $19,606 | $6,265 | $13,341 |
| 2014 | $2,185 | $18,511 | $6,824 | $11,687 |
Source: Public Records
Map
Nearby Homes