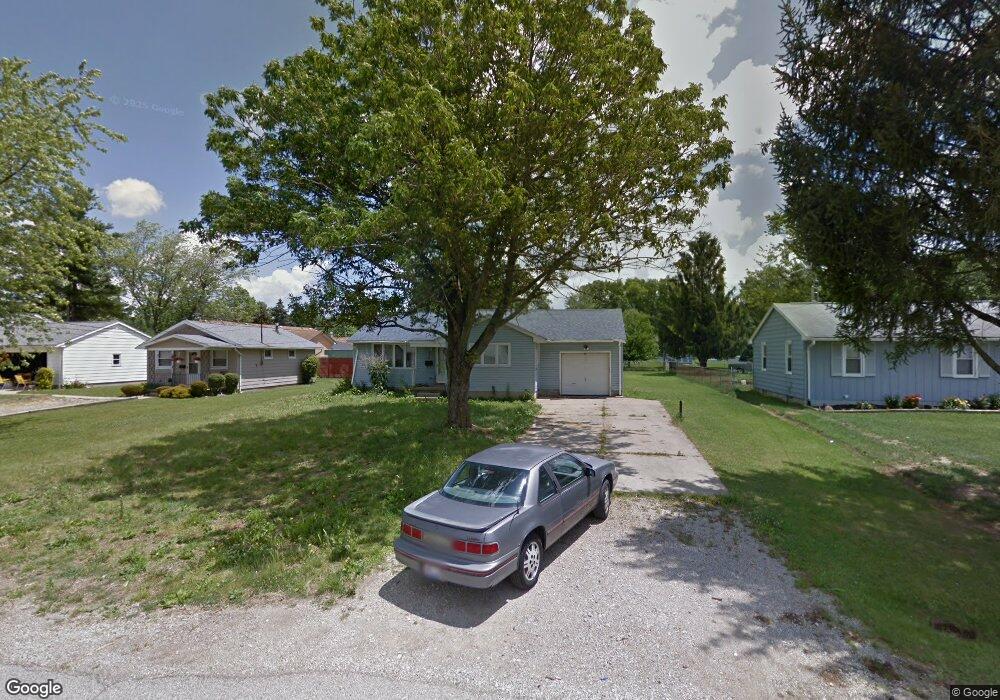
434 Apple Ln Mansfield, OH 44905
Estimated Value: $155,936 - $204,000
3
Beds
1
Bath
1,144
Sq Ft
$159/Sq Ft
Est. Value
About This Home
This home is located at 434 Apple Ln, Mansfield, OH 44905 and is currently estimated at $181,984, approximately $159 per square foot. 434 Apple Ln is a home located in Richland County with nearby schools including Madison High School, Temple-Christian School, and St. Mary Catholic School.
Ownership History
Date
Name
Owned For
Owner Type
Purchase Details
Closed on
Jan 25, 2018
Sold by
Mottayaw Wes
Bought by
Benavides Oscar S and Benavides Lynn
Current Estimated Value
Purchase Details
Closed on
Dec 15, 2014
Sold by
Benavides Oscar and Benavides Oscar S
Bought by
Mottayaw West
Purchase Details
Closed on
Jun 16, 2004
Sold by
Mottayaw Wesley C
Bought by
Benavides Oscar S and Benavides Lynn
Home Financials for this Owner
Home Financials are based on the most recent Mortgage that was taken out on this home.
Original Mortgage
$80,000
Interest Rate
6.46%
Mortgage Type
Purchase Money Mortgage
Purchase Details
Closed on
Mar 21, 1997
Sold by
Kriegel Daniel L
Bought by
Mottayaw Wesley C
Home Financials for this Owner
Home Financials are based on the most recent Mortgage that was taken out on this home.
Original Mortgage
$52,000
Interest Rate
7.5%
Mortgage Type
New Conventional
Create a Home Valuation Report for This Property
The Home Valuation Report is an in-depth analysis detailing your home's value as well as a comparison with similar homes in the area
Home Values in the Area
Average Home Value in this Area
Purchase History
| Date | Buyer | Sale Price | Title Company |
|---|---|---|---|
| Benavides Oscar S | -- | None Available | |
| Mottayaw West | $18,000 | Chicago Title Agency Of Nort | |
| Benavides Oscar S | -- | Chelsea Title Agency | |
| Mottayaw Wesley C | $60,000 | -- |
Source: Public Records
Mortgage History
| Date | Status | Borrower | Loan Amount |
|---|---|---|---|
| Previous Owner | Benavides Oscar S | $80,000 | |
| Previous Owner | Mottayaw Wesley C | $52,000 |
Source: Public Records
Tax History Compared to Growth
Tax History
| Year | Tax Paid | Tax Assessment Tax Assessment Total Assessment is a certain percentage of the fair market value that is determined by local assessors to be the total taxable value of land and additions on the property. | Land | Improvement |
|---|---|---|---|---|
| 2024 | $1,725 | $35,220 | $6,970 | $28,250 |
| 2023 | $1,725 | $35,220 | $6,970 | $28,250 |
| 2022 | $1,687 | $25,600 | $6,340 | $19,260 |
| 2021 | $1,397 | $25,600 | $6,340 | $19,260 |
| 2020 | $1,425 | $25,600 | $6,340 | $19,260 |
| 2019 | $1,348 | $21,520 | $5,330 | $16,190 |
| 2018 | $1,261 | $21,520 | $5,330 | $16,190 |
| 2017 | $1,218 | $21,520 | $5,330 | $16,190 |
| 2016 | $1,278 | $21,510 | $5,060 | $16,450 |
| 2015 | $1,269 | $21,510 | $5,060 | $16,450 |
| 2014 | $1,207 | $21,510 | $5,060 | $16,450 |
| 2012 | $1,207 | $22,640 | $5,330 | $17,310 |
Source: Public Records
Map
Nearby Homes
- 419 N Mcelroy Rd
- 1628 Park Ave E
- 155 Ford Rd N
- 155 Ford Rd N Unit Lot 30
- 632 Coachman Rd
- 1303 Park Ave E
- 602 Champion Rd
- 671 Coachman Rd
- 1226 Evergreen Ave W
- 683 Coachman Rd
- 1282 Redman Ave
- 641 Laver Rd
- 644 Skyline Rd
- 536 Gordon Rd
- 0 Mcelroy Rd
- 76 Ford Rd N
- 76 Ford Rd N Unit 20
- 1199 Evergreen Ave W
- 1183 Evergreen Ave W
- 291 Stewart Rd N