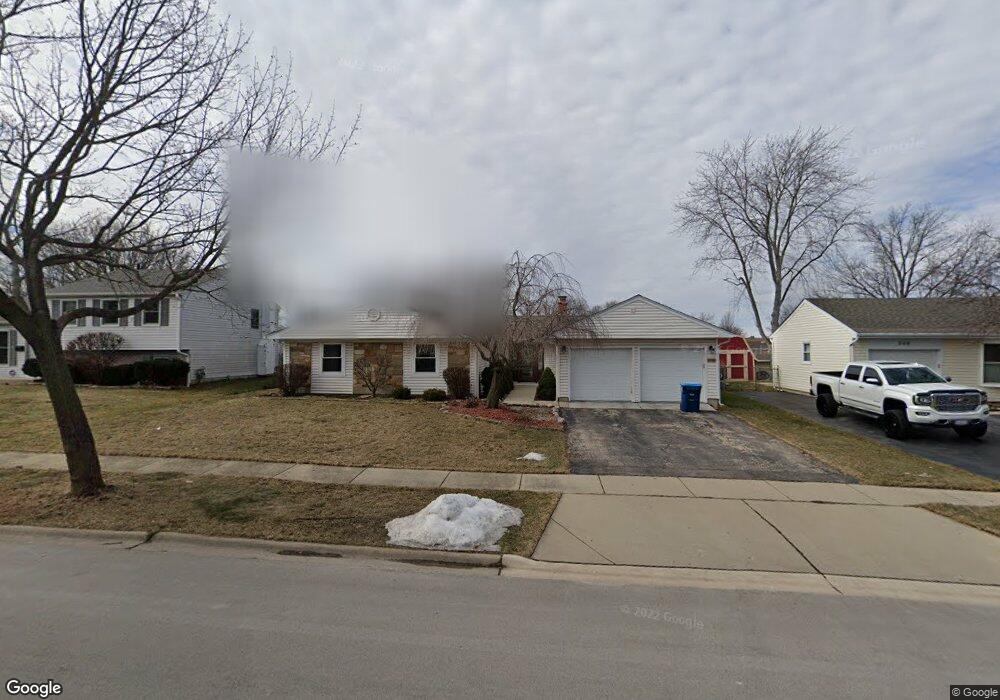
434 Argyll Ln Schaumburg, IL 60194
Hoover Park NeighborhoodEstimated Value: $439,000 - $476,000
3
Beds
2
Baths
2,062
Sq Ft
$221/Sq Ft
Est. Value
About This Home
This home is located at 434 Argyll Ln, Schaumburg, IL 60194 and is currently estimated at $456,262, approximately $221 per square foot. 434 Argyll Ln is a home located in Cook County with nearby schools including Hoover Math And Science Academy, Helen Keller Junior High School, and Schaumburg High School.
Ownership History
Date
Name
Owned For
Owner Type
Purchase Details
Closed on
Jun 23, 2023
Sold by
Vela Christopher M and Vela Maureen E
Bought by
Christopher Vela Living Trust and Maureen Vela Living Trust
Current Estimated Value
Purchase Details
Closed on
Apr 23, 2007
Sold by
Szpunar Waldemar
Bought by
Vela Christopher M and Vela Maureen E
Home Financials for this Owner
Home Financials are based on the most recent Mortgage that was taken out on this home.
Original Mortgage
$205,000
Interest Rate
6.2%
Mortgage Type
Unknown
Purchase Details
Closed on
Jul 25, 2006
Sold by
Colombo Patrick J and Colombo Patricia A
Bought by
Szpunar Waldemar
Home Financials for this Owner
Home Financials are based on the most recent Mortgage that was taken out on this home.
Original Mortgage
$229,600
Interest Rate
6.82%
Mortgage Type
New Conventional
Create a Home Valuation Report for This Property
The Home Valuation Report is an in-depth analysis detailing your home's value as well as a comparison with similar homes in the area
Home Values in the Area
Average Home Value in this Area
Purchase History
| Date | Buyer | Sale Price | Title Company |
|---|---|---|---|
| Christopher Vela Living Trust | -- | None Listed On Document | |
| Vela Christopher M | $395,000 | First American | |
| Szpunar Waldemar | $287,000 | Git |
Source: Public Records
Mortgage History
| Date | Status | Borrower | Loan Amount |
|---|---|---|---|
| Previous Owner | Vela Christopher M | $205,000 | |
| Previous Owner | Szpunar Waldemar | $229,600 |
Source: Public Records
Tax History
| Year | Tax Paid | Tax Assessment Tax Assessment Total Assessment is a certain percentage of the fair market value that is determined by local assessors to be the total taxable value of land and additions on the property. | Land | Improvement |
|---|---|---|---|---|
| 2025 | $8,876 | $42,001 | $7,268 | $34,733 |
| 2024 | $8,876 | $35,000 | $5,985 | $29,015 |
| 2023 | $8,578 | $35,000 | $5,985 | $29,015 |
| 2022 | $8,578 | $35,000 | $5,985 | $29,015 |
| 2021 | $7,390 | $27,711 | $4,061 | $23,650 |
| 2020 | $7,330 | $27,711 | $4,061 | $23,650 |
| 2019 | $7,426 | $31,136 | $4,061 | $27,075 |
| 2018 | $7,159 | $27,290 | $3,633 | $23,657 |
| 2017 | $7,064 | $27,290 | $3,633 | $23,657 |
| 2016 | $6,848 | $27,290 | $3,633 | $23,657 |
| 2015 | $5,912 | $22,386 | $3,206 | $19,180 |
| 2014 | $5,864 | $22,386 | $3,206 | $19,180 |
| 2013 | $5,696 | $22,386 | $3,206 | $19,180 |
Source: Public Records
Map
Nearby Homes
- 426 Argyll Ln
- 658 Claridge Cir Unit 99
- 917 Aimtree Place
- 424 N Salem Dr
- 712 Scarbrough Cir Unit 126
- 828 Harwich Ln
- 222 Nauset Ln Unit 1344
- 202 Nauset Ln Unit 1321
- 203 Barcliffe Ln Unit 1063
- 120 Ellington Dr
- 395 Washington Blvd
- 923 Daniels Ct Unit 2
- 400 Green River Ct
- 230 Princeton St
- 670 Lakeview Ln
- 660 Flagstaff Ln
- 1220 Dorchester Ln
- 18 Dennis Ct Unit 741
- 1318 Yarmouth Ct Unit 712
- 630 Bode Rd
- 75 Pleasant Lot#0012 Dr
- 999 Confidential Rd
- LOT 15 Airdrie Estates
- 41A N Pleasant Dr
- 41 N Pleasant Dr
- 500 Argyll Ln
- 430 Argyll Ln
- 435 Abbington Place Unit 12
- 431 Abbington Place
- 503 Abbington Place
- 506 Argyll Ln
- 427 Abbington Place
- 435 Argyll Ln
- 431 Argyll Ln
- 507 Abbington Place
- 510 Argyll Ln
- 427 Argyll Ln
- 422 Argyll Ln Unit 12
- 423 Abbington Place
- 507 Argyll Ln
Your Personal Tour Guide
Ask me questions while you tour the home.