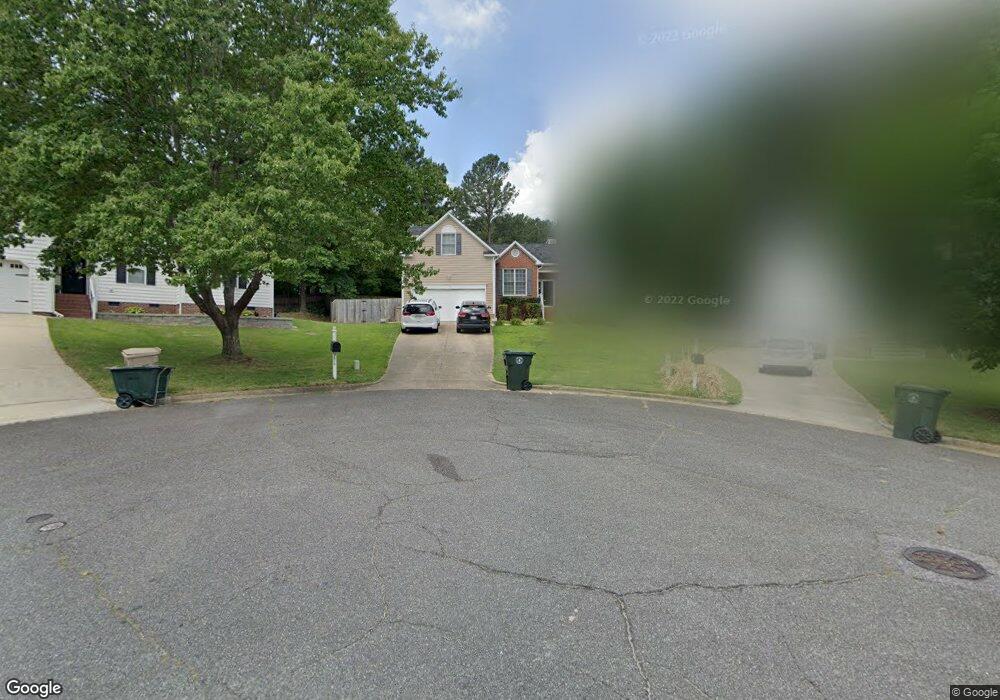
434 Brims Way Garner, NC 27529
Estimated Value: $389,000 - $400,000
3
Beds
2
Baths
1,825
Sq Ft
$217/Sq Ft
Est. Value
About This Home
This home is located at 434 Brims Way, Garner, NC 27529 and is currently estimated at $396,203, approximately $217 per square foot. 434 Brims Way is a home located in Wake County with nearby schools including Timber Drive Elementary, North Garner Middle, and Garner High.
Ownership History
Date
Name
Owned For
Owner Type
Purchase Details
Closed on
Jun 10, 2019
Sold by
Orozco Shanna
Bought by
Moore Ashley and Moore Gregory
Current Estimated Value
Home Financials for this Owner
Home Financials are based on the most recent Mortgage that was taken out on this home.
Original Mortgage
$211,500
Outstanding Balance
$185,960
Interest Rate
4.1%
Mortgage Type
New Conventional
Estimated Equity
$210,243
Purchase Details
Closed on
Oct 22, 2015
Sold by
Mills Courtney Elizabeth
Bought by
The Mills Group Llc
Purchase Details
Closed on
Sep 4, 2015
Sold by
The Mills Group Llc
Bought by
Mills Courtney Elizabeth
Purchase Details
Closed on
Sep 1, 2015
Sold by
Secretary Of Veters Affaris
Bought by
The Mills Group Llc
Purchase Details
Closed on
Dec 3, 2014
Sold by
Wigfall Benjamin J and Wigfall Lorraine H
Bought by
Secretary Of Veterans Affairs
Purchase Details
Closed on
Jun 26, 2001
Sold by
Harvey Clifford and Harvey Lynne
Bought by
Wigfall Benjamin J and Wigfall Lorraine H
Create a Home Valuation Report for This Property
The Home Valuation Report is an in-depth analysis detailing your home's value as well as a comparison with similar homes in the area
Home Values in the Area
Average Home Value in this Area
Purchase History
| Date | Buyer | Sale Price | Title Company |
|---|---|---|---|
| Moore Ashley | $235,000 | None Available | |
| The Mills Group Llc | -- | Attorney | |
| Mills Courtney Elizabeth | -- | Attorney | |
| The Mills Group Llc | -- | Attorney | |
| Secretary Of Veterans Affairs | $158,193 | None Available | |
| Wigfall Benjamin J | $167,000 | -- |
Source: Public Records
Mortgage History
| Date | Status | Borrower | Loan Amount |
|---|---|---|---|
| Open | Moore Ashley | $211,500 |
Source: Public Records
Tax History
| Year | Tax Paid | Tax Assessment Tax Assessment Total Assessment is a certain percentage of the fair market value that is determined by local assessors to be the total taxable value of land and additions on the property. | Land | Improvement |
|---|---|---|---|---|
| 2025 | $4,189 | $401,965 | $110,000 | $291,965 |
| 2024 | $4,174 | $401,965 | $110,000 | $291,965 |
Source: Public Records
Map
Nearby Homes
- 116 Grand Springs Ct Unit 204
- 200 Coachman Dr
- 1408 Edgebrook Dr
- 104 Whithorne Dr
- 102 Castill Place
- 132 Carriage House Trail
- 1611 Misty Meadow Ln
- 1209 Highland Rd
- 108 Drumbuie Place
- 117 Village Green Trail
- 1302 Buffaloe Rd
- 109 Hiddenwood Ct
- 6026 Colonial Dr
- 102 Rhum Place
- 1201 Poplar Ave
- 104 Gilder Woods Dr
- 154 Easy Wind Ln
- 1016 Buckhorn Rd
- 619 Benfield Ct
- 224 Shady Hollow Ln
- 430 Brims Way
- 438 Brims Way
- 103 Dowan Ct
- 107 Dowan Ct
- 426 Brims Way
- 435 Brims Way
- 427 Brims Way
- 102 Dowan Ct
- 422 Brims Way
- 111 Dowan Ct
- 431 Brims Way
- 418 Brims Way
- 421 Brims Way
- 212 Heather Springs Dr
- 216 Heather Springs Dr
- 112 Dowan Ct
- 115 Dowan Ct
- 417 Brims Way
- 220 Heather Springs Dr
- 410 Brims Way
Your Personal Tour Guide
Ask me questions while you tour the home.