Estimated Value: $159,179
--
Bed
--
Bath
2,358
Sq Ft
$68/Sq Ft
Est. Value
About This Home
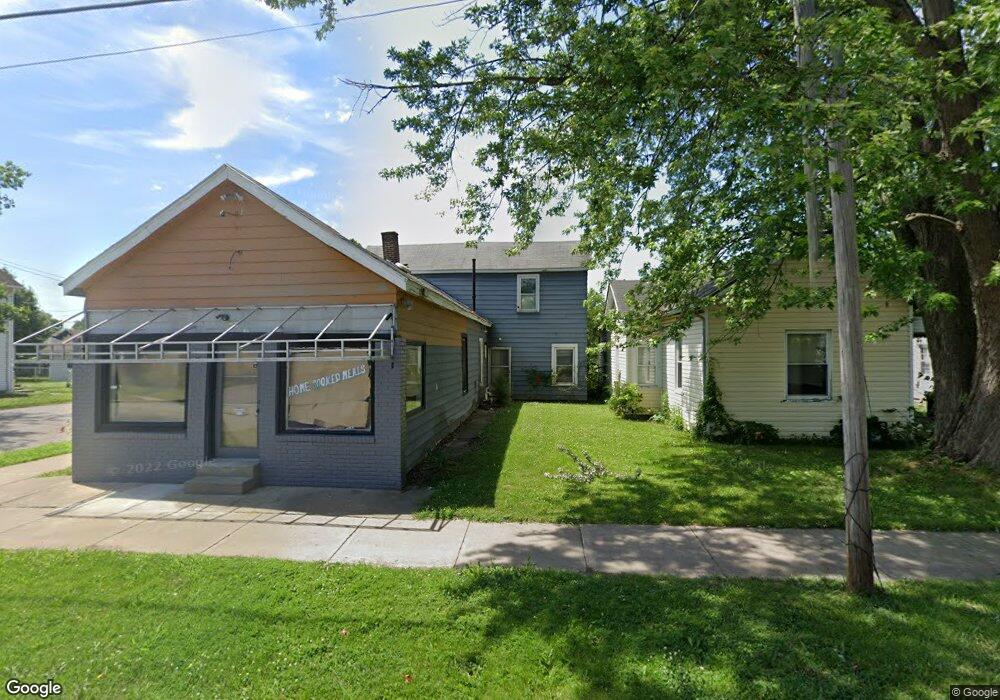
This home is located at 434 Cincinnati Ave, Xenia, OH 45385 and is currently estimated at $159,179, approximately $67 per square foot. 434 Cincinnati Ave is a home located in Greene County with nearby schools including Xenia High School, Summit Academy Community School for Alternative Learners - Xenia, and Legacy Christian Academy.
Ownership History
Date
Name
Owned For
Owner Type
Purchase Details
Closed on
Jan 21, 2022
Sold by
Idrees Ashraf and Idrees Mohamed
Bought by
Idrees Company Llc
Current Estimated Value
Purchase Details
Closed on
Sep 19, 2013
Sold by
Security National Bank
Bought by
Idress Ashraf
Purchase Details
Closed on
Sep 8, 2004
Sold by
Robinette John E and Robinette Rebecca A
Bought by
Carr Scott G and Carr Connie L
Home Financials for this Owner
Home Financials are based on the most recent Mortgage that was taken out on this home.
Original Mortgage
$72,150
Interest Rate
6.17%
Mortgage Type
Commercial
Purchase Details
Closed on
Apr 26, 2001
Sold by
Craft Harry D and Craft Bonnie L
Bought by
Robinette John E and Robinette Rebecca A
Home Financials for this Owner
Home Financials are based on the most recent Mortgage that was taken out on this home.
Original Mortgage
$63,500
Interest Rate
7.03%
Mortgage Type
Seller Take Back
Create a Home Valuation Report for This Property
The Home Valuation Report is an in-depth analysis detailing your home's value as well as a comparison with similar homes in the area
Home Values in the Area
Average Home Value in this Area
Purchase History
| Date | Buyer | Sale Price | Title Company |
|---|---|---|---|
| Idrees Company Llc | -- | None Listed On Document | |
| Idress Ashraf | $7,900 | None Available | |
| Carr Scott G | $162,000 | -- | |
| Robinette John E | $70,000 | -- |
Source: Public Records
Mortgage History
| Date | Status | Borrower | Loan Amount |
|---|---|---|---|
| Previous Owner | Carr Scott G | $72,150 | |
| Previous Owner | Robinette John E | $63,500 |
Source: Public Records
Tax History Compared to Growth
Tax History
| Year | Tax Paid | Tax Assessment Tax Assessment Total Assessment is a certain percentage of the fair market value that is determined by local assessors to be the total taxable value of land and additions on the property. | Land | Improvement |
|---|---|---|---|---|
| 2024 | $677 | $13,360 | $3,990 | $9,370 |
| 2023 | $677 | $13,360 | $3,990 | $9,370 |
| 2022 | $752 | $12,640 | $3,990 | $8,650 |
| 2021 | $764 | $12,640 | $3,990 | $8,650 |
| 2020 | $736 | $12,640 | $3,990 | $8,650 |
| 2019 | $723 | $11,940 | $3,990 | $7,950 |
| 2018 | $729 | $11,940 | $3,990 | $7,950 |
| 2017 | $717 | $11,940 | $3,990 | $7,950 |
| 2016 | $718 | $11,660 | $3,990 | $7,670 |
| 2015 | $720 | $11,660 | $3,990 | $7,670 |
| 2014 | $696 | $11,660 | $3,990 | $7,670 |
Source: Public Records
Map
Nearby Homes
- 424 Cincinnati Ave
- 418 Cincinnati Ave
- 410 Cincinnati Ave
- 372 Center St
- 365 Center St
- 466 Cincinnati Ave
- 360 Center St
- 435 Cincinnati Ave
- 421 Cincinnati Ave
- 476 Cincinnati Ave
- 339 Center St
- 350 Center St
- 411 Cincinnati Ave
- 451 Cincinnati Ave
- 403 Cincinnati Ave
- 465 Cincinnati Ave
- 296 Charles St
- 338 Center St
- 378 Cincinnati Ave
- 378 Cincinnati Ave