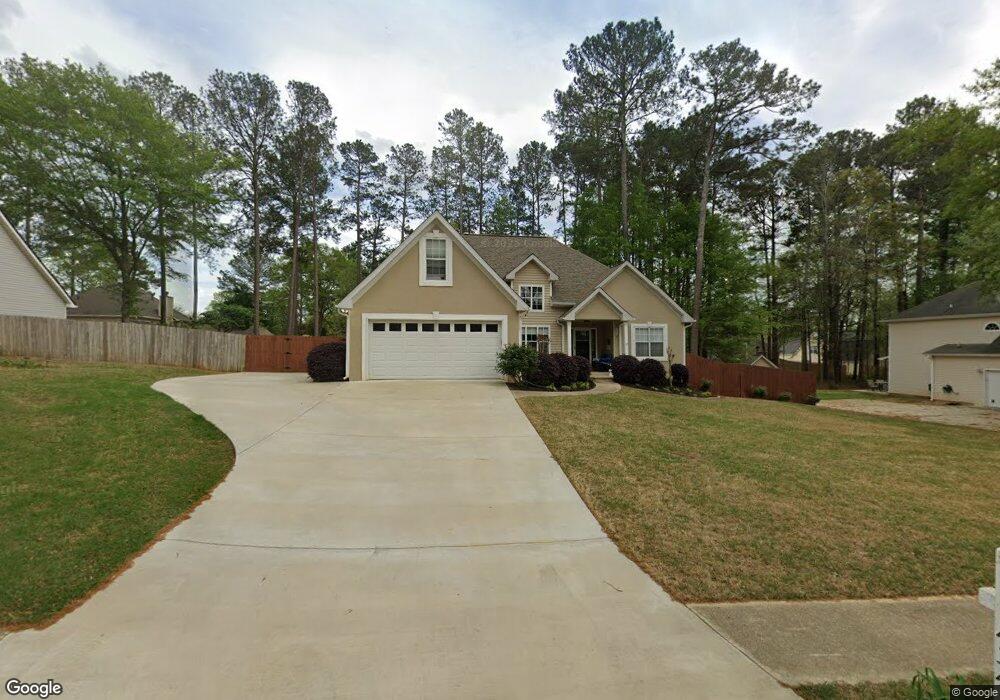
434 Crosshaven Way McDonough, GA 30253
Estimated Value: $309,071 - $325,000
3
Beds
2
Baths
1,987
Sq Ft
$159/Sq Ft
Est. Value
About This Home
This home is located at 434 Crosshaven Way, McDonough, GA 30253 and is currently estimated at $316,018, approximately $159 per square foot. 434 Crosshaven Way is a home located in Henry County with nearby schools including Union Grove Middle School, Union Grove High School, and Hickory Flat Elementary School.
Ownership History
Date
Name
Owned For
Owner Type
Purchase Details
Closed on
Feb 7, 2024
Sold by
Johnson Neil G
Bought by
Johnson Neil G and Johnson Diana Rae
Current Estimated Value
Purchase Details
Closed on
Feb 19, 2021
Sold by
Jagus Paul
Bought by
Johnson Neil
Purchase Details
Closed on
Dec 6, 2013
Sold by
Bailey Michael W
Bought by
Jagus Paul L and Jagus Rhonda C
Home Financials for this Owner
Home Financials are based on the most recent Mortgage that was taken out on this home.
Original Mortgage
$142,500
Interest Rate
4.19%
Mortgage Type
New Conventional
Purchase Details
Closed on
Jun 25, 1999
Sold by
Dehaas Yolanda A and Dehaas Charles P
Bought by
Bailey Michael W and Bailey Cynthia P
Home Financials for this Owner
Home Financials are based on the most recent Mortgage that was taken out on this home.
Original Mortgage
$45,000
Interest Rate
7.27%
Mortgage Type
New Conventional
Purchase Details
Closed on
Nov 13, 1996
Sold by
Mnw Constr
Bought by
Dehaas Charles Yolanda
Create a Home Valuation Report for This Property
The Home Valuation Report is an in-depth analysis detailing your home's value as well as a comparison with similar homes in the area
Home Values in the Area
Average Home Value in this Area
Purchase History
| Date | Buyer | Sale Price | Title Company |
|---|---|---|---|
| Johnson Neil G | -- | -- | |
| Johnson Neil | $225,000 | -- | |
| Jagus Paul L | $150,000 | -- | |
| Bailey Michael W | $132,900 | -- | |
| Dehaas Charles Yolanda | $122,500 | -- |
Source: Public Records
Mortgage History
| Date | Status | Borrower | Loan Amount |
|---|---|---|---|
| Previous Owner | Jagus Paul L | $142,500 | |
| Previous Owner | Bailey Michael W | $45,000 | |
| Closed | Dehaas Charles Yolanda | $0 |
Source: Public Records
Tax History Compared to Growth
Tax History
| Year | Tax Paid | Tax Assessment Tax Assessment Total Assessment is a certain percentage of the fair market value that is determined by local assessors to be the total taxable value of land and additions on the property. | Land | Improvement |
|---|---|---|---|---|
| 2025 | $2,483 | $138,680 | $16,000 | $122,680 |
| 2024 | $2,483 | $130,480 | $16,000 | $114,480 |
| 2023 | $3,541 | $130,000 | $14,000 | $116,000 |
| 2022 | $3,098 | $90,000 | $12,870 | $77,130 |
| 2021 | $2,230 | $78,520 | $14,000 | $64,520 |
| 2020 | $2,060 | $71,320 | $12,000 | $59,320 |
| 2019 | $1,956 | $66,920 | $10,000 | $56,920 |
| 2018 | $1,871 | $63,320 | $10,000 | $53,320 |
| 2016 | $1,668 | $54,720 | $8,000 | $46,720 |
| 2015 | $1,620 | $51,480 | $8,000 | $43,480 |
| 2014 | $1,645 | $52,000 | $8,000 | $44,000 |
Source: Public Records
Map
Nearby Homes
- 212 Himalaya Way
- 248 Cranapple Ln
- 146 Himalaya Way
- 236 Himalaya Way
- 479 Crosshaven Way
- 733 Stonehaven Chase
- 401 Crosshaven Way
- 1008 Carlyle Place
- 152 Rockport Dr
- 1150 Strath Clyde Way
- 1125 Strath Clyde Way
- 153 Rockport Dr
- 1181 Paramount Dr
- 176 Cranapple Ln
- 221 Summit View Dr
- 0 E Lake Pkwy Unit 9004730
- 209 Brannans Walk
- 248 Brannans Walk
- 172 Summit View Dr
- 796 Rock Ln
- 428 Crosshaven Way
- 440 Crosshaven Way
- 863 Clifton Ridge
- 1052 Arbor Way
- 0 Crosshaven Way Unit 8712045
- 0 Crosshaven Way Unit 7018260
- 422 Crosshaven Way
- 1048 Arbor Way
- 435 Crosshaven Way
- 429 Crosshaven Way
- 867 Clifton Ridge
- 0 Clifton Ridge Unit 8887313
- 0 Clifton Ridge Unit 7008752
- 0 Clifton Ridge Unit 7235420
- 441 Crosshaven Way
- 1044 Arbor Way
- 240 Cranapple Ln
- 144 Warbler Way
- 316 Wichita Way
- 449 Cranberry Cir