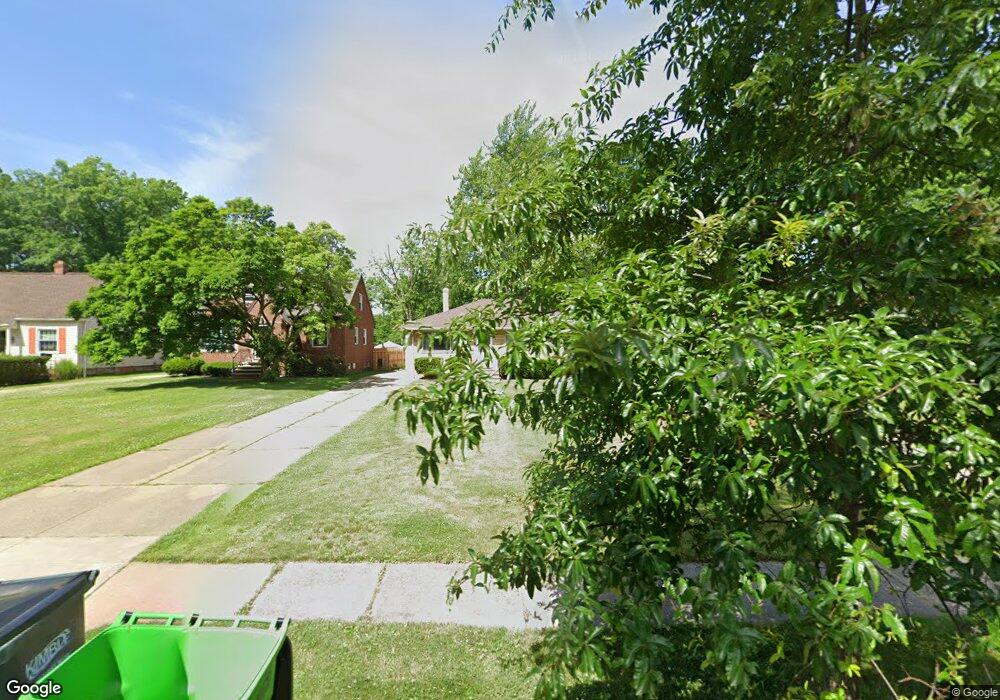
434 E 266th St Euclid, OH 44132
Estimated Value: $130,000 - $177,637
3
Beds
2
Baths
1,178
Sq Ft
$134/Sq Ft
Est. Value
About This Home
This home is located at 434 E 266th St, Euclid, OH 44132 and is currently estimated at $157,659, approximately $133 per square foot. 434 E 266th St is a home located in Cuyahoga County with nearby schools including Shoreview Elementary School, Euclid High School, and Mater Dei Academy.
Ownership History
Date
Name
Owned For
Owner Type
Purchase Details
Closed on
Mar 23, 2006
Sold by
Fannie Mae
Bought by
Sharp Marsha D
Current Estimated Value
Home Financials for this Owner
Home Financials are based on the most recent Mortgage that was taken out on this home.
Original Mortgage
$82,400
Outstanding Balance
$45,785
Interest Rate
6.37%
Mortgage Type
Fannie Mae Freddie Mac
Estimated Equity
$111,874
Purchase Details
Closed on
Sep 22, 2005
Sold by
Bailey Vernon J and Bailey Celina
Bought by
Fanniemae and Federal National Mortgage Association
Purchase Details
Closed on
May 25, 2001
Sold by
Gliebe Maria
Bought by
Bailey Vernon J
Home Financials for this Owner
Home Financials are based on the most recent Mortgage that was taken out on this home.
Original Mortgage
$125,300
Interest Rate
7.23%
Purchase Details
Closed on
Jan 1, 1975
Bought by
Gliebe Gottfried and Gliebe Maria
Create a Home Valuation Report for This Property
The Home Valuation Report is an in-depth analysis detailing your home's value as well as a comparison with similar homes in the area
Home Values in the Area
Average Home Value in this Area
Purchase History
We collect this data history from publicly available records. To have your information removed, we recommend requesting removal directly through your county’s website.
| Date | Buyer | Sale Price | Title Company |
|---|---|---|---|
| Sharp Marsha D | $103,000 | Phoenix Title Agency | |
| Fanniemae | $83,334 | Ohio Title Corp | |
| Bailey Vernon J | $132,000 | Executive Title Agency Corp | |
| Gliebe Gottfried | -- | -- |
Source: Public Records
Mortgage History
We collect this data history from publicly available records. To have your information removed, we recommend requesting removal directly through your county’s website.
| Date | Status | Borrower | Loan Amount |
|---|---|---|---|
| Open | Sharp Marsha D | $82,400 | |
| Previous Owner | Bailey Vernon J | $125,300 |
Source: Public Records
Tax History
| Year | Tax Paid | Tax Assessment Tax Assessment Total Assessment is a certain percentage of the fair market value that is determined by local assessors to be the total taxable value of land and additions on the property. | Land | Improvement |
|---|---|---|---|---|
| 2025 | $3,556 | $53,620 | $11,305 | $42,315 |
| 2024 | $3,672 | $53,620 | $11,305 | $42,315 |
| 2023 | $3,331 | $38,750 | $8,580 | $30,170 |
| 2022 | $3,255 | $38,750 | $8,580 | $30,170 |
| 2021 | $3,628 | $38,750 | $8,580 | $30,170 |
| 2020 | $3,439 | $33,390 | $7,390 | $26,010 |
| 2019 | $3,094 | $95,400 | $21,100 | $74,300 |
| 2018 | $3,068 | $33,390 | $7,390 | $26,010 |
| 2017 | $3,270 | $29,200 | $6,130 | $23,070 |
| 2016 | $3,277 | $29,200 | $6,130 | $23,070 |
| 2015 | $2,981 | $29,200 | $6,130 | $23,070 |
| 2014 | $2,981 | $29,200 | $6,130 | $23,070 |
Source: Public Records
Map
Nearby Homes
- 311 E 262nd St
- 434 E 272nd St
- 325 E 257th St
- 27182 Oriole Ave
- 355 E 257th St
- 26831 Shoreview Ave
- 610 E 266th St
- 26530 Shoreview Ave
- 25591 Forestview Ave
- 406 E 274th St
- 257 E 270th St
- 25801 Lake Shore Blvd Unit 112
- 346 Walworth Ave
- 571 E 260th St
- 364 Walworth Ave
- 25600 Zeman Ave
- 110 E 252nd St
- 25401 Farringdon Ave
- 25151 Zeman Ave
- 754 Hemlock Dr
Your Personal Tour Guide
Ask me questions while you tour the home.