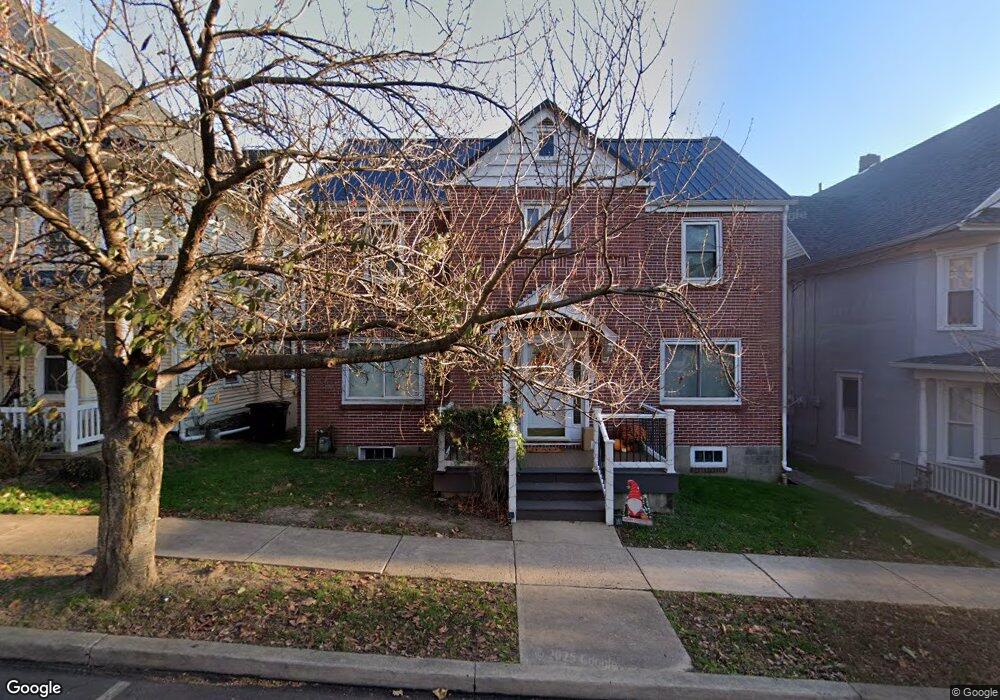
434 E 3rd St Bloomsburg, PA 17815
Estimated Value: $171,000 - $236,196
Studio
--
Bath
2,100
Sq Ft
$99/Sq Ft
Est. Value
About This Home
This home is located at 434 E 3rd St, Bloomsburg, PA 17815 and is currently estimated at $207,049, approximately $98 per square foot. 434 E 3rd St is a home located in Columbia County with nearby schools including Memorial Elementary School, Bloomsburg Area Middle School, and Bloomsburg Area High School.
Ownership History
Date
Name
Owned For
Owner Type
Purchase Details
Closed on
Aug 16, 2021
Sold by
Culver Abigail D and Klena Hunter
Bought by
Culver Elisabeth D and Culver Robert A
Current Estimated Value
Purchase Details
Closed on
Jul 14, 2016
Sold by
Fannie Mae
Bought by
Culver Abigail D
Purchase Details
Closed on
Jun 2, 2015
Sold by
Reedy Pilien
Bought by
Federal National Mortgage Association
Purchase Details
Closed on
Feb 6, 2015
Sold by
Reedy Pilien
Bought by
Rubin Bernie
Purchase Details
Closed on
Jul 18, 2007
Sold by
Reedy Michael G and Reedy Pilien
Bought by
Reedy Pilien
Home Financials for this Owner
Home Financials are based on the most recent Mortgage that was taken out on this home.
Original Mortgage
$108,000
Interest Rate
6.78%
Mortgage Type
New Conventional
Create a Home Valuation Report for This Property
The Home Valuation Report is an in-depth analysis detailing your home's value as well as a comparison with similar homes in the area
Home Values in the Area
Average Home Value in this Area
Purchase History
| Date | Buyer | Sale Price | Title Company |
|---|---|---|---|
| Culver Elisabeth D | -- | None Available | |
| Culver Abigail D | $80,000 | Servicelink Llc | |
| Federal National Mortgage Association | $1,792 | None Available | |
| Rubin Bernie | $4,310 | None Available | |
| Reedy Pilien | -- | None Available |
Source: Public Records
Mortgage History
| Date | Status | Borrower | Loan Amount |
|---|---|---|---|
| Previous Owner | Reedy Pilien | $108,000 |
Source: Public Records
Tax History
| Year | Tax Paid | Tax Assessment Tax Assessment Total Assessment is a certain percentage of the fair market value that is determined by local assessors to be the total taxable value of land and additions on the property. | Land | Improvement |
|---|---|---|---|---|
| 2025 | $3,655 | $40,516 | $0 | $0 |
| 2024 | $3,594 | $40,517 | $4,527 | $35,990 |
| 2023 | $3,331 | $40,517 | $4,527 | $35,990 |
| 2022 | $3,210 | $40,517 | $4,527 | $35,990 |
| 2021 | $3,142 | $40,517 | $4,527 | $35,990 |
| 2020 | $3,012 | $40,517 | $4,527 | $35,990 |
| 2019 | $2,962 | $40,517 | $4,527 | $35,990 |
| 2018 | $2,893 | $40,517 | $4,527 | $35,990 |
| 2017 | $2,745 | $40,517 | $4,527 | $35,990 |
| 2016 | -- | $40,517 | $4,527 | $35,990 |
| 2015 | -- | $40,517 | $4,527 | $35,990 |
| 2014 | -- | $40,517 | $4,527 | $35,990 |
Source: Public Records
Map
Nearby Homes
- 440442 E Third St
- 428430 E Third St
- 424 E 3rd St
- 446 E 3rd St
- 450452 E Third St
- 439 E 4th St
- 445 E 4th St
- 429 E 4th St
- 437 E 3rd St
- 423 E 3rd St
- 415417 E Fourth St
- 400402 E Third St
- 325 S Penn St
- 325 S Penn St
- 445 E 3rd St
- 451453 E Fourth St
- 411 E 3rd St
- 453 E 3rd St
- 457459 E Fourth St
- 500502 E Third St
Your Personal Tour Guide
Ask me questions while you tour the home.