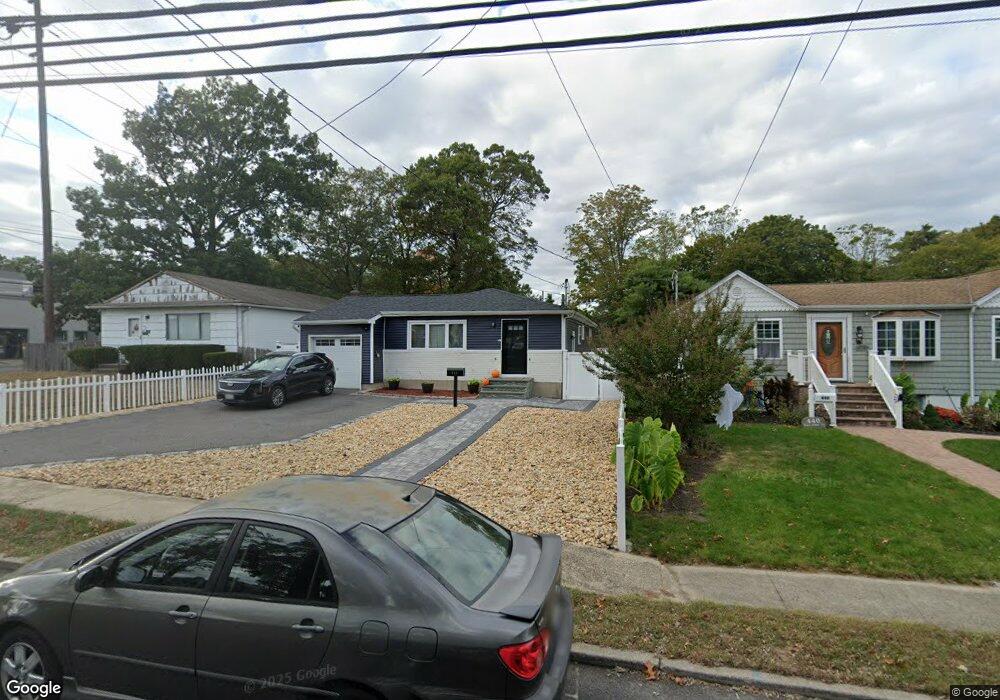
434 E John St Lindenhurst, NY 11757
Estimated Value: $576,000 - $716,000
4
Beds
2
Baths
1,025
Sq Ft
$612/Sq Ft
Est. Value
About This Home
This home is located at 434 E John St, Lindenhurst, NY 11757 and is currently estimated at $627,316, approximately $612 per square foot. 434 E John St is a home located in Suffolk County with nearby schools including Daniel Street School, Lindenhurst Middle School, and Lindenhurst Senior High School.
Ownership History
Date
Name
Owned For
Owner Type
Purchase Details
Closed on
Jan 16, 2019
Sold by
Wilmington Svgs Fund Soc
Bought by
Faixa Preta Productions
Current Estimated Value
Purchase Details
Closed on
Jun 21, 2018
Sold by
Rodriguez Luke A and Rodriguez Christian
Bought by
Wilmington Svngs Fund Soc
Purchase Details
Closed on
May 24, 2010
Sold by
Rodriguez Luke A and Rodriguez Christian
Bought by
Rodriguez Luke A and Rodriguez Christian
Purchase Details
Closed on
Jul 22, 2005
Sold by
Tripi Joseph P
Bought by
Rodriguez Paula
Create a Home Valuation Report for This Property
The Home Valuation Report is an in-depth analysis detailing your home's value as well as a comparison with similar homes in the area
Home Values in the Area
Average Home Value in this Area
Purchase History
| Date | Buyer | Sale Price | Title Company |
|---|---|---|---|
| Faixa Preta Productions | $248,000 | -- | |
| Wilmington Svngs Fund Soc | $320,000 | -- | |
| Rodriguez Luke A | -- | -- | |
| Rodriguez Paula | $345,000 | Ralph Chappell |
Source: Public Records
Tax History
| Year | Tax Paid | Tax Assessment Tax Assessment Total Assessment is a certain percentage of the fair market value that is determined by local assessors to be the total taxable value of land and additions on the property. | Land | Improvement |
|---|---|---|---|---|
| 2024 | $11,472 | $3,080 | $310 | $2,770 |
| 2023 | $10,331 | $3,080 | $310 | $2,770 |
| 2022 | $9,372 | $3,080 | $310 | $2,770 |
| 2021 | $9,372 | $3,080 | $310 | $2,770 |
| 2020 | $9,852 | $3,080 | $310 | $2,770 |
| 2019 | $10,964 | $0 | $0 | $0 |
| 2018 | $9,392 | $3,080 | $310 | $2,770 |
| 2017 | $9,392 | $3,080 | $310 | $2,770 |
| 2016 | $9,283 | $3,080 | $310 | $2,770 |
| 2015 | -- | $3,080 | $310 | $2,770 |
| 2014 | -- | $3,080 | $310 | $2,770 |
Source: Public Records
Map
Nearby Homes
- 323 Grand Ave
- 436 N Ontario Ave
- 475 N Putnam Ave
- 417 N Monroe Ave
- 792 Frankford Rd
- 792 Glendale Rd
- 551 Grand Ave
- 117 Avenue B
- 825 Weber Ave
- 248 Arnold Ave
- 285 Daniel St
- 41 N Kings Ave
- 247 N Greene Ave
- 455 N Hamilton Ave
- 244 N Erie Ave
- 361 Nevada St
- 3 Cord Ave
- 669 East Dr
- 261 E Hoffman Ave
- 166 & 170 Woodrow Pkwy
Your Personal Tour Guide
Ask me questions while you tour the home.