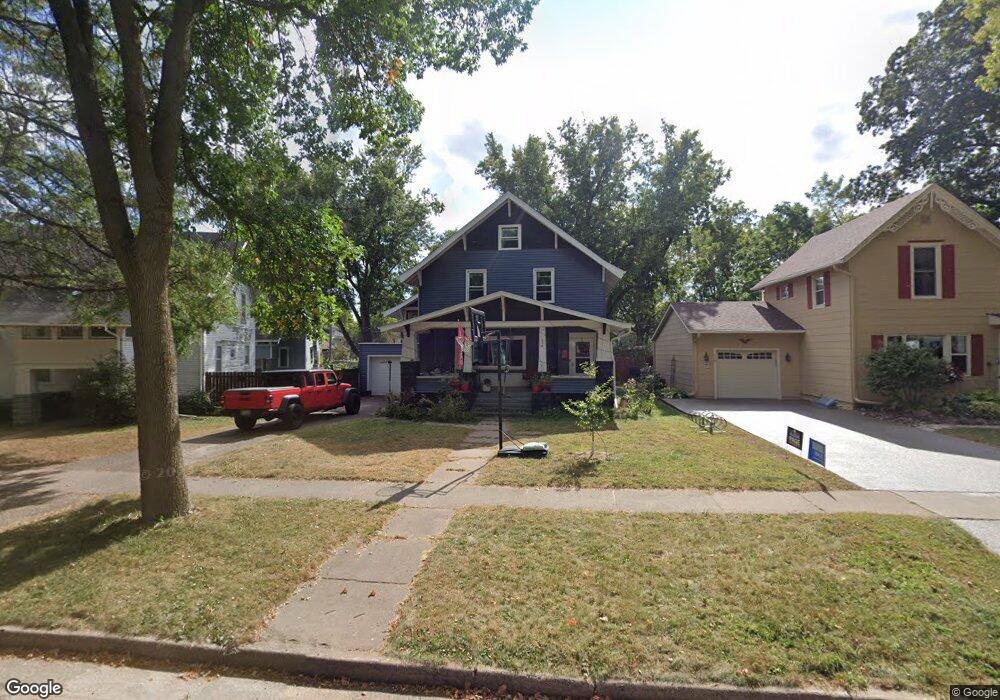
434 E Maple St River Falls, WI 54022
Estimated Value: $259,728 - $321,000
3
Beds
2
Baths
1,920
Sq Ft
$149/Sq Ft
Est. Value
About This Home
This home is located at 434 E Maple St, River Falls, WI 54022 and is currently estimated at $286,932, approximately $149 per square foot. 434 E Maple St is a home located in Pierce County with nearby schools including Greenwood Elementary School, Meyer Middle School, and River Falls High School.
Ownership History
Date
Name
Owned For
Owner Type
Purchase Details
Closed on
Mar 16, 2015
Sold by
Singewald Joseph T and Singewald Gayle R
Bought by
Tharp Keely P
Current Estimated Value
Home Financials for this Owner
Home Financials are based on the most recent Mortgage that was taken out on this home.
Original Mortgage
$80,000
Outstanding Balance
$60,528
Interest Rate
3.67%
Mortgage Type
New Conventional
Estimated Equity
$226,404
Purchase Details
Closed on
Sep 15, 2010
Sold by
Stieger William J
Bought by
Singewald Joseph T and Singewald Gayle R
Home Financials for this Owner
Home Financials are based on the most recent Mortgage that was taken out on this home.
Original Mortgage
$141,450
Interest Rate
4.42%
Mortgage Type
New Conventional
Purchase Details
Closed on
Jul 31, 2007
Sold by
Orowell Jewell
Bought by
Styer William
Create a Home Valuation Report for This Property
The Home Valuation Report is an in-depth analysis detailing your home's value as well as a comparison with similar homes in the area
Home Values in the Area
Average Home Value in this Area
Purchase History
| Date | Buyer | Sale Price | Title Company |
|---|---|---|---|
| Tharp Keely P | $169,000 | Pierce County Abstract & Tit | |
| Singewald Joseph T | $136,500 | None Available | |
| Styer William | -- | None Available |
Source: Public Records
Mortgage History
| Date | Status | Borrower | Loan Amount |
|---|---|---|---|
| Open | Tharp Keely P | $80,000 | |
| Previous Owner | Singewald Joseph T | $141,450 |
Source: Public Records
Tax History
| Year | Tax Paid | Tax Assessment Tax Assessment Total Assessment is a certain percentage of the fair market value that is determined by local assessors to be the total taxable value of land and additions on the property. | Land | Improvement |
|---|---|---|---|---|
| 2025 | $3,941 | $240,200 | $53,500 | $186,700 |
| 2024 | $3,718 | $176,200 | $41,200 | $135,000 |
| 2023 | $3,613 | $176,200 | $41,200 | $135,000 |
| 2022 | $3,111 | $176,200 | $41,200 | $135,000 |
| 2021 | $3,118 | $176,200 | $41,200 | $135,000 |
| 2020 | $3,467 | $141,100 | $32,000 | $109,100 |
| 2019 | $3,267 | $141,100 | $32,000 | $109,100 |
| 2018 | $3,261 | $141,100 | $32,000 | $109,100 |
| 2017 | $3,140 | $141,100 | $32,000 | $109,100 |
| 2016 | $3,013 | $141,100 | $32,000 | $109,100 |
| 2015 | $2,968 | $141,100 | $32,000 | $109,100 |
| 2014 | $3,509 | $188,900 | $29,300 | $159,600 |
| 2013 | $3,605 | $188,900 | $29,300 | $159,600 |
Source: Public Records
Map
Nearby Homes
Your Personal Tour Guide
Ask me questions while you tour the home.