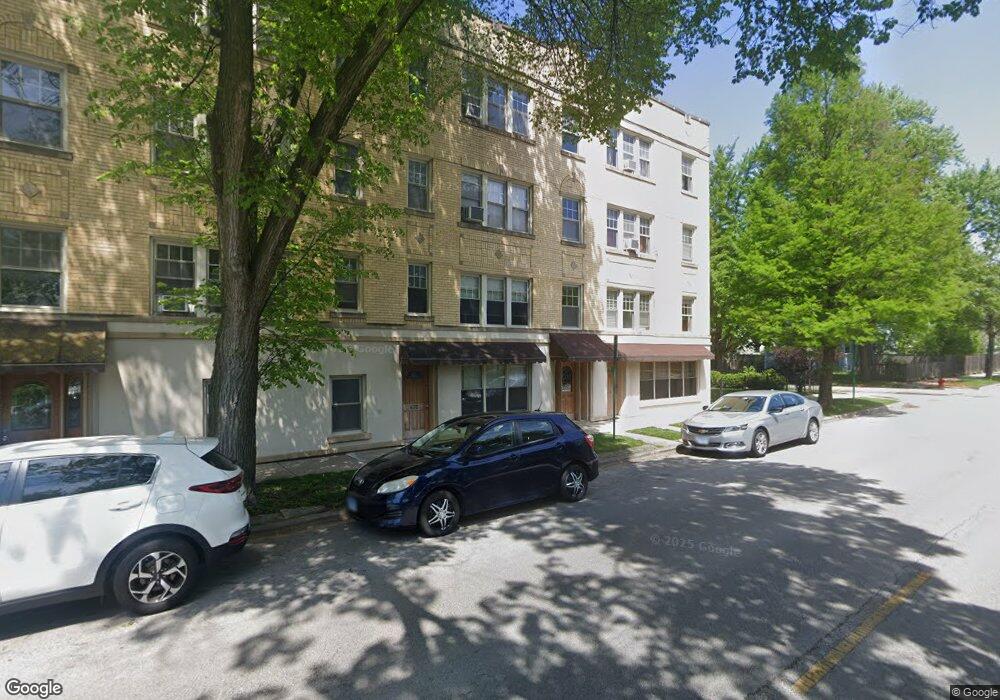
434 Harrison St Unit 2 Oak Park, IL 60304
Estimated Value: $111,000 - $134,682
1
Bed
1
Bath
13,668
Sq Ft
$9/Sq Ft
Est. Value
About This Home
This home is located at 434 Harrison St Unit 2, Oak Park, IL 60304 and is currently estimated at $126,921, approximately $9 per square foot. 434 Harrison St Unit 2 is a home located in Cook County with nearby schools including Longfellow Elementary School, Percy Julian Middle School, and Oak Park and River Forest High School.
Ownership History
Date
Name
Owned For
Owner Type
Purchase Details
Closed on
Apr 24, 2020
Sold by
Family Credit Counseling Service Inc
Bought by
Kilbride Garrett
Current Estimated Value
Home Financials for this Owner
Home Financials are based on the most recent Mortgage that was taken out on this home.
Original Mortgage
$67,120
Outstanding Balance
$59,347
Interest Rate
3.3%
Mortgage Type
New Conventional
Estimated Equity
$67,574
Purchase Details
Closed on
Dec 28, 2010
Sold by
Fannie Mae
Bought by
Family Credit Counseling Service Inc
Purchase Details
Closed on
May 6, 2010
Sold by
Macias Rene J and Macias Sarah T
Bought by
Federal National Mortgage Association
Purchase Details
Closed on
Oct 3, 2006
Sold by
430 Harrison Llc
Bought by
Macias Rene J and Macias Sarah T
Home Financials for this Owner
Home Financials are based on the most recent Mortgage that was taken out on this home.
Original Mortgage
$123,920
Interest Rate
6.5%
Mortgage Type
Unknown
Create a Home Valuation Report for This Property
The Home Valuation Report is an in-depth analysis detailing your home's value as well as a comparison with similar homes in the area
Home Values in the Area
Average Home Value in this Area
Purchase History
| Date | Buyer | Sale Price | Title Company |
|---|---|---|---|
| Kilbride Garrett | $84,000 | Chicago Title | |
| Family Credit Counseling Service Inc | $37,500 | First American | |
| Federal National Mortgage Association | -- | None Available | |
| Macias Rene J | $155,000 | Republic Title Company |
Source: Public Records
Mortgage History
| Date | Status | Borrower | Loan Amount |
|---|---|---|---|
| Open | Kilbride Garrett | $67,120 | |
| Previous Owner | Macias Rene J | $123,920 |
Source: Public Records
Tax History Compared to Growth
Tax History
| Year | Tax Paid | Tax Assessment Tax Assessment Total Assessment is a certain percentage of the fair market value that is determined by local assessors to be the total taxable value of land and additions on the property. | Land | Improvement |
|---|---|---|---|---|
| 2024 | $1,885 | $9,098 | $641 | $8,457 |
| 2023 | $1,620 | $9,098 | $641 | $8,457 |
| 2022 | $1,620 | $7,641 | $435 | $7,206 |
| 2021 | $1,613 | $7,640 | $435 | $7,205 |
| 2020 | $1,657 | $7,640 | $435 | $7,205 |
| 2019 | $2,624 | $10,269 | $400 | $9,869 |
| 2018 | $2,524 | $10,269 | $400 | $9,869 |
| 2017 | $2,490 | $10,269 | $400 | $9,869 |
| 2016 | $2,269 | $8,135 | $332 | $7,803 |
| 2015 | $1,988 | $8,135 | $332 | $7,803 |
| 2014 | $1,865 | $8,135 | $332 | $7,803 |
| 2013 | $3,353 | $12,932 | $332 | $12,600 |
Source: Public Records
Map
Nearby Homes
- 840 S Cuyler Ave
- 644 Harrison St Unit 1
- 2718 S East Ave
- 737 Clarence Ave
- 920 Wesley Ave Unit 1
- 924 Wesley Ave Unit 2
- 642 Van Buren St Unit 2
- 721 Clarence Ave
- 1036 Highland Ave
- 723 Wesley Ave
- 1169 S Taylor Ave
- 537 S Cuyler Ave
- 1157 Gunderson Ave
- 617 S Lombard Ave
- 915 S Oak Park Ave Unit 1-B
- 1160 S Cuyler Ave
- 929 S Oak Park Ave Unit 1NE
- 1140 S Harvey Ave
- 706 S Oak Park Ave
- 537 S Harvey Ave
- 434 Harrison St Unit 3
- 434 Harrison St Unit 4343
- 436 Harrison St Unit 4362
- 436 Harrison St Unit 4363
- 436 Harrison St Unit 4361
- 434 Harrison St Unit 4342
- 434 Harrison St Unit 4341
- 436 Harrison St Unit 1
- 436 Harrison St Unit 3
- 434 Harrison St Unit 1
- 432 Harrison St Unit G
- 432 Harrison St Unit 432G
- 432 Harrison St Unit 4323
- 432 Harrison St Unit 4322
- 432 Harrison St Unit 4321
- 432 Harrison St Unit 2
- 432 Harrison St Unit 3
- 430 Harrison St Unit 430G
- 430 Harrison St Unit 4301
- 430 Harrison St Unit 4303