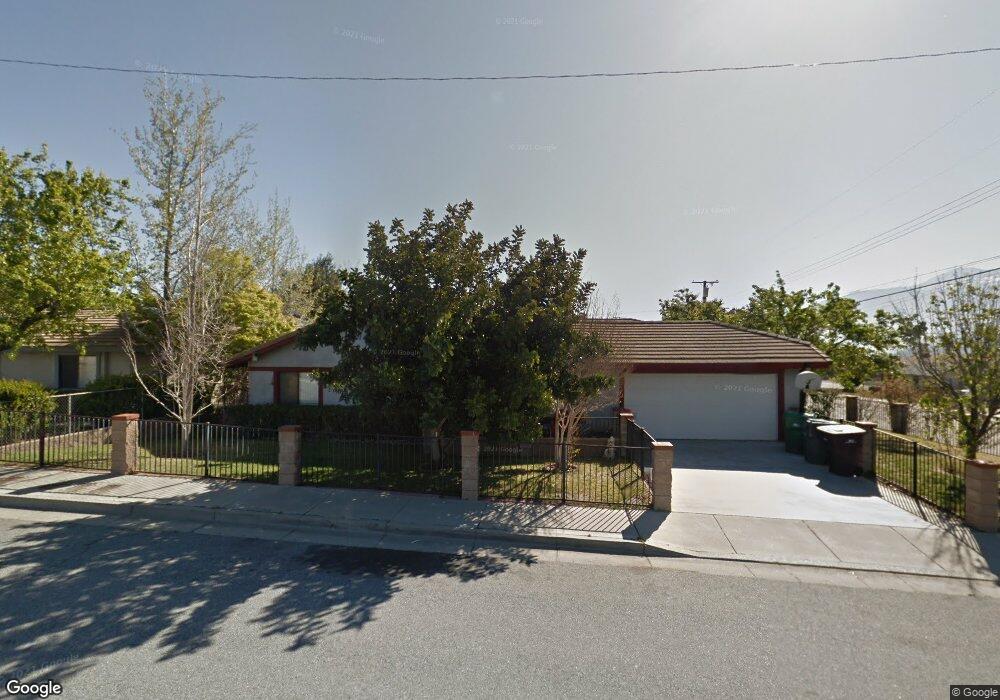
434 N Cherry St Banning, CA 92220
Estimated Value: $522,000 - $682,000
9
Beds
3
Baths
3,415
Sq Ft
$172/Sq Ft
Est. Value
About This Home
This home is located at 434 N Cherry St, Banning, CA 92220 and is currently estimated at $586,333, approximately $171 per square foot. 434 N Cherry St is a home located in Riverside County with nearby schools including Banning High School.
Ownership History
Date
Name
Owned For
Owner Type
Purchase Details
Closed on
Jan 8, 1994
Sold by
Levias Mack G and Levias Penny J
Bought by
Levias Mack Gene and Levias Penny Jeanette
Current Estimated Value
Home Financials for this Owner
Home Financials are based on the most recent Mortgage that was taken out on this home.
Original Mortgage
$112,000
Interest Rate
7.24%
Mortgage Type
Commercial
Purchase Details
Closed on
Dec 29, 1993
Sold by
Doucette Matthew Nicholas and Doucette Maria Teresa
Bought by
Krause Maria Del Carmen and Krause Maria Del Carmen Vallejo
Home Financials for this Owner
Home Financials are based on the most recent Mortgage that was taken out on this home.
Original Mortgage
$112,000
Interest Rate
7.24%
Mortgage Type
Commercial
Purchase Details
Closed on
Dec 13, 1993
Sold by
Levias Mack G and Levias Penny K
Bought by
Levias Mack G and Levias Penny J
Home Financials for this Owner
Home Financials are based on the most recent Mortgage that was taken out on this home.
Original Mortgage
$112,000
Interest Rate
7.24%
Mortgage Type
Commercial
Create a Home Valuation Report for This Property
The Home Valuation Report is an in-depth analysis detailing your home's value as well as a comparison with similar homes in the area
Home Values in the Area
Average Home Value in this Area
Purchase History
| Date | Buyer | Sale Price | Title Company |
|---|---|---|---|
| Levias Mack Gene | -- | -- | |
| Krause Maria Del Carmen | -- | -- | |
| Levias Mack G | -- | Northern Counties Title |
Source: Public Records
Mortgage History
| Date | Status | Borrower | Loan Amount |
|---|---|---|---|
| Previous Owner | Levias Mack G | $112,000 |
Source: Public Records
Tax History
| Year | Tax Paid | Tax Assessment Tax Assessment Total Assessment is a certain percentage of the fair market value that is determined by local assessors to be the total taxable value of land and additions on the property. | Land | Improvement |
|---|---|---|---|---|
| 2025 | $3,806 | $237,285 | $18,741 | $218,544 |
| 2023 | $3,806 | $228,072 | $18,014 | $210,058 |
| 2022 | $3,187 | $223,601 | $17,661 | $205,940 |
| 2021 | $3,126 | $219,217 | $17,315 | $201,902 |
| 2020 | $3,099 | $216,970 | $17,138 | $199,832 |
| 2019 | $3,051 | $212,716 | $16,802 | $195,914 |
| 2018 | $3,031 | $208,546 | $16,473 | $192,073 |
| 2017 | $2,982 | $204,457 | $16,150 | $188,307 |
| 2016 | $2,837 | $200,449 | $15,834 | $184,615 |
| 2015 | $2,796 | $197,441 | $15,598 | $181,843 |
| 2014 | $2,779 | $193,576 | $15,294 | $178,282 |
Source: Public Records
Map
Nearby Homes
- 1130 E George St
- 263 N Evans St
- 245 N Evans St
- 685 N Allen St
- 1010 E Nicolet St
- 1469 E George St
- 755 N Allen St
- 582 N Almond Way
- 957 E George St
- 917 E Nicolet St Unit 157
- 906 N Allen St
- 1396 Ramsey
- 0 E Williams St
- 0 N Almond Way Unit IG25103642
- 0 N Blanchard St
- 0 N Hargrave St Unit IV26013127
- 1501 E Wilson St
- 1308 N Phillips St
- 1164 N Hermosa Ave
- 1264 N Hargrave St
- 450 N Cherry St
- 1309 E Nicolet St
- 1209 E Nicolet St
- 480 N Cherry St
- 435 N Cherry St
- 1284 E Nicolet St
- 1323 E Nicolet St
- 439 N Allen St
- 1266 E Nicolet St
- 1292 E Nicolet St
- 490 N Cherry St
- 1310 E Nicolet St
- 1219 E Nicolet St
- 463 N Cherry St
- 1242 E Nicolet St
- 494 N Cherry St
- 477 N Allen St
- 1216 E Nicolet St
- 340 N Cherry St
- 1345 E Nicolet St
Your Personal Tour Guide
Ask me questions while you tour the home.