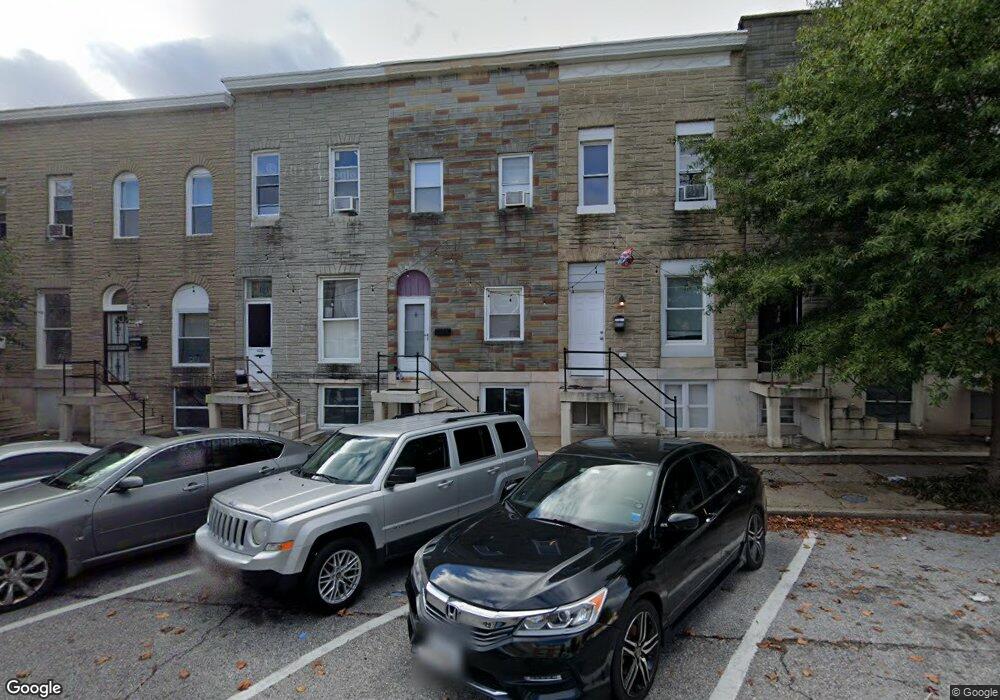
434 N Luzerne Ave Baltimore, MD 21224
McElderry Park NeighborhoodEstimated Value: $108,000 - $165,273
2
Beds
1
Bath
1,372
Sq Ft
$100/Sq Ft
Est. Value
About This Home
This home is located at 434 N Luzerne Ave, Baltimore, MD 21224 and is currently estimated at $136,637, approximately $99 per square foot. 434 N Luzerne Ave is a home located in Baltimore City with nearby schools including William Paca Elementary School, Booker T. Washington Middle School, and Paul Laurence Dunbar High School.
Ownership History
Date
Name
Owned For
Owner Type
Purchase Details
Closed on
Sep 21, 2007
Sold by
Nielsen Lars Innes
Bought by
Nielson Laura E
Current Estimated Value
Home Financials for this Owner
Home Financials are based on the most recent Mortgage that was taken out on this home.
Original Mortgage
$99,000
Outstanding Balance
$60,352
Interest Rate
6.83%
Mortgage Type
Purchase Money Mortgage
Estimated Equity
$76,285
Purchase Details
Closed on
May 17, 2005
Sold by
Kelly Keith
Bought by
Nielsen Lars Innes
Purchase Details
Closed on
Aug 10, 2004
Sold by
Kelly Keith
Bought by
Nielsen Lars Innes
Purchase Details
Closed on
Jan 22, 2002
Sold by
Secretary Of The United States
Bought by
Kelly Keith
Purchase Details
Closed on
Oct 9, 2001
Sold by
Wiggins Margaret E
Bought by
Secretary Of The United States and Department Of Housing & Urban
Purchase Details
Closed on
Feb 24, 1997
Sold by
Lindsey Frederick
Bought by
Wiggins Margaret E and Long Margaret G
Create a Home Valuation Report for This Property
The Home Valuation Report is an in-depth analysis detailing your home's value as well as a comparison with similar homes in the area
Home Values in the Area
Average Home Value in this Area
Purchase History
| Date | Buyer | Sale Price | Title Company |
|---|---|---|---|
| Nielson Laura E | $110,000 | -- | |
| Nielsen Lars Innes | $62,000 | -- | |
| Nielsen Lars Innes | $62,000 | -- | |
| Kelly Keith | $6,001 | -- | |
| Secretary Of The United States | $48,221 | -- | |
| Wiggins Margaret E | $45,000 | -- |
Source: Public Records
Mortgage History
| Date | Status | Borrower | Loan Amount |
|---|---|---|---|
| Open | Nielson Laura E | $99,000 |
Source: Public Records
Tax History Compared to Growth
Tax History
| Year | Tax Paid | Tax Assessment Tax Assessment Total Assessment is a certain percentage of the fair market value that is determined by local assessors to be the total taxable value of land and additions on the property. | Land | Improvement |
|---|---|---|---|---|
| 2025 | $2,806 | $126,700 | $30,000 | $96,700 |
| 2024 | $2,806 | $119,467 | $0 | $0 |
| 2023 | $2,636 | $112,233 | $0 | $0 |
| 2022 | $2,478 | $105,000 | $30,000 | $75,000 |
| 2021 | $2,337 | $99,033 | $0 | $0 |
| 2020 | $2,196 | $93,067 | $0 | $0 |
| 2019 | $2,046 | $87,100 | $30,000 | $57,100 |
| 2018 | $2,056 | $87,100 | $30,000 | $57,100 |
| 2017 | $2,056 | $87,100 | $0 | $0 |
| 2016 | $2,122 | $98,500 | $0 | $0 |
| 2015 | $2,122 | $95,533 | $0 | $0 |
| 2014 | $2,122 | $92,567 | $0 | $0 |
Source: Public Records
Map
Nearby Homes
- 442 N Luzerne Ave
- 424 N Luzerne Ave
- 422 N Luzerne Ave
- 2512 Jefferson St
- 510 N Luzerne Ave
- 417 N Milton Ave
- 507 N Milton Ave
- 244 N Rose St
- 519 N Rose St
- 508 N Glover St
- 230 N Luzerne Ave
- 510 N Glover St
- 514 N Rose St
- 430 N Milton Ave
- 518 N Rose St
- 525 N Rose St
- 418 N Milton Ave
- 507 N Glover St
- 227 N Rose St
- 235 N Luzerne Ave
- 436 N Luzerne Ave
- 432 N Luzerne Ave
- 438 N Luzerne Ave
- 430 N Luzerne Ave
- 426 N Luzerne Ave
- 444 N Luzerne Ave
- 427 N Rose St
- 425 N Rose St
- 429 N Rose St
- 423 N Rose St
- 421 N Rose St
- 446 N Luzerne Ave
- 2517 Jefferson St
- 419 N Rose St
- 420 N Luzerne Ave
- 2515 Jefferson St
- 448 N Luzerne Ave
- 415 N Rose St
- 417 N Rose St
- 417 N Rose St