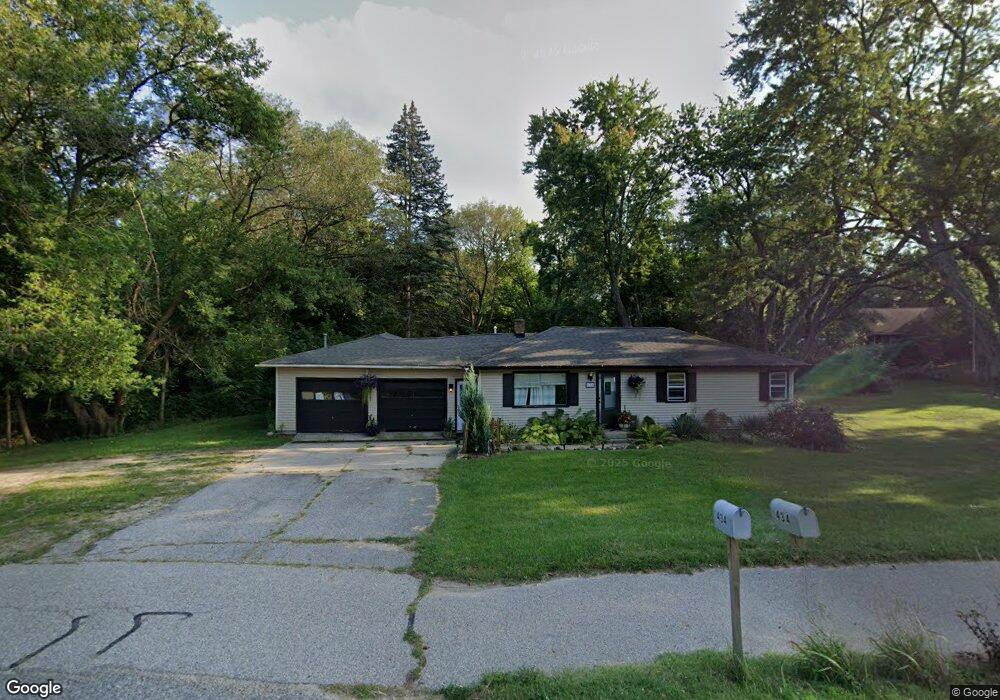
434 Riley St Holland, MI 49424
Estimated Value: $293,000 - $335,203
3
Beds
1
Bath
980
Sq Ft
$315/Sq Ft
Est. Value
About This Home
This home is located at 434 Riley St, Holland, MI 49424 and is currently estimated at $308,551, approximately $314 per square foot. 434 Riley St is a home located in Ottawa County with nearby schools including Woodside Elementary School, Macatawa Bay Middle School, and West Ottawa High School.
Ownership History
Date
Name
Owned For
Owner Type
Purchase Details
Closed on
Jun 25, 2025
Sold by
Randall Amber Marie
Bought by
Clear Water Capital Llc
Current Estimated Value
Home Financials for this Owner
Home Financials are based on the most recent Mortgage that was taken out on this home.
Original Mortgage
$224,900
Outstanding Balance
$224,323
Interest Rate
6.81%
Mortgage Type
Construction
Estimated Equity
$84,228
Purchase Details
Closed on
Apr 22, 2021
Sold by
Bosch Bryan P Vanden and Bosch Karen Vanden
Bought by
Garden House Properties Llc
Purchase Details
Closed on
Jan 27, 2021
Sold by
Vandenbosch Family Properties Llc
Bought by
Garden House Properties Llc
Purchase Details
Closed on
Jul 28, 2009
Sold by
Baker Ronald Jay and Baker Suzanne Fox
Bought by
Vandenbosch Family Properties Llc
Create a Home Valuation Report for This Property
The Home Valuation Report is an in-depth analysis detailing your home's value as well as a comparison with similar homes in the area
Home Values in the Area
Average Home Value in this Area
Purchase History
| Date | Buyer | Sale Price | Title Company |
|---|---|---|---|
| Clear Water Capital Llc | $185,000 | Irongate Title Agency | |
| Randall Amber Marie | $160,000 | Irongate Title Agency | |
| Garden House Properties Llc | -- | None Available | |
| Garden House Properties Llc | -- | None Available | |
| Vandenbosch Family Properties Llc | $72,000 | Chicago Title |
Source: Public Records
Mortgage History
| Date | Status | Borrower | Loan Amount |
|---|---|---|---|
| Open | Clear Water Capital Llc | $224,900 |
Source: Public Records
Tax History Compared to Growth
Tax History
| Year | Tax Paid | Tax Assessment Tax Assessment Total Assessment is a certain percentage of the fair market value that is determined by local assessors to be the total taxable value of land and additions on the property. | Land | Improvement |
|---|---|---|---|---|
| 2025 | $3,042 | $130,800 | $0 | $0 |
| 2024 | $2,305 | $125,900 | $0 | $0 |
| 2023 | $2,224 | $103,200 | $0 | $0 |
| 2022 | $2,840 | $97,100 | $0 | $0 |
| 2021 | $2,760 | $83,700 | $0 | $0 |
| 2020 | $1,406 | $82,800 | $0 | $0 |
| 2019 | $2,148 | $39,500 | $0 | $0 |
| 2018 | $2,676 | $56,400 | $16,900 | $39,500 |
| 2017 | $2,641 | $51,900 | $0 | $0 |
| 2016 | $2,627 | $46,600 | $0 | $0 |
| 2015 | $1,914 | $43,700 | $0 | $0 |
| 2014 | $1,914 | $41,000 | $0 | $0 |
Source: Public Records
Map
Nearby Homes
- 888 S Kingwood Ct
- 901 Butternut Dr
- 961 Shadybrook Dr
- 790 Mayfield Ave
- 14159 Pheasant Run
- 785 Mary Ave
- 257 Mae Rose Ave
- 286 Felch St
- 1020 Katra Ln Unit 52
- 13652 Signature Dr
- 13654 Signature Dr
- 14145 Carol St
- 125 Liberty St
- 14298 Carol St
- 14710 Riley St
- V/L Jack St
- 490 James St
- 2918 Foxboro Ln
- 3150 Joshua Ct
- Integrity 1610 Plan at Silverwater