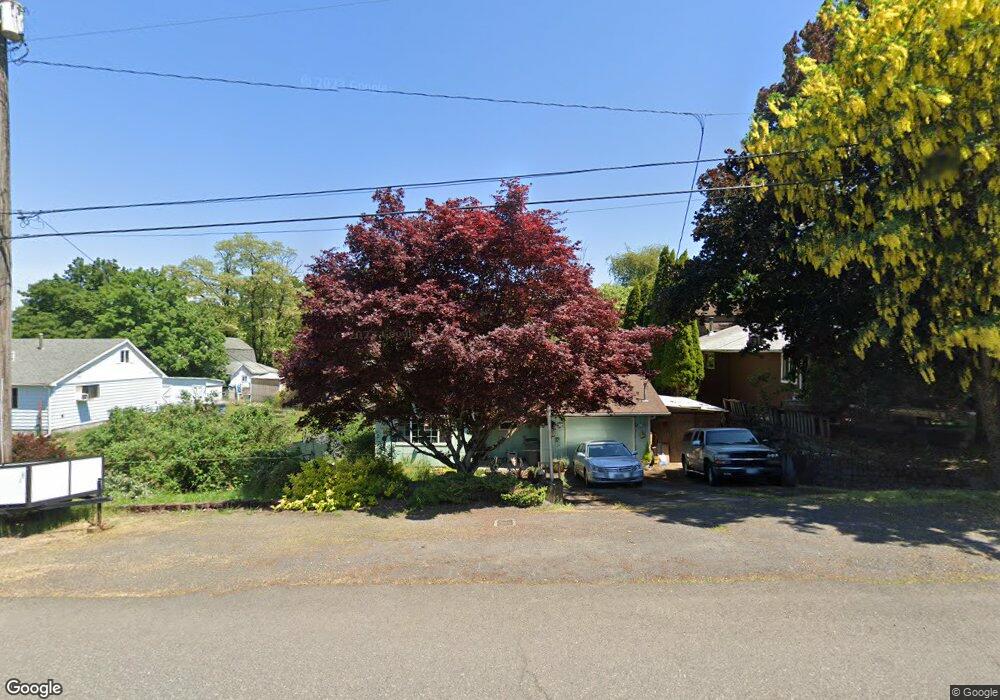
434 S 12th St Saint Helens, OR 97051
Estimated Value: $325,000 - $350,000
3
Beds
1
Bath
1,380
Sq Ft
$246/Sq Ft
Est. Value
About This Home
This home is located at 434 S 12th St, Saint Helens, OR 97051 and is currently estimated at $339,049, approximately $245 per square foot. 434 S 12th St is a home located in Columbia County with nearby schools including St. Helens High School and Columbia County Christian School.
Ownership History
Date
Name
Owned For
Owner Type
Purchase Details
Closed on
Oct 12, 2010
Sold by
Sherman Michael and Sherman Linda
Bought by
Cupp Roy and Cupp Carolyn
Current Estimated Value
Home Financials for this Owner
Home Financials are based on the most recent Mortgage that was taken out on this home.
Original Mortgage
$92,383
Outstanding Balance
$60,839
Interest Rate
4.31%
Mortgage Type
Commercial
Estimated Equity
$278,210
Purchase Details
Closed on
Jul 31, 2006
Sold by
Richmond Jason
Bought by
Sherman Michael and Sherman Linda
Home Financials for this Owner
Home Financials are based on the most recent Mortgage that was taken out on this home.
Original Mortgage
$115,200
Interest Rate
7.4%
Mortgage Type
Commercial
Purchase Details
Closed on
May 13, 2005
Sold by
Amos William D and Amos Roseanne M
Bought by
Richmond Jason
Home Financials for this Owner
Home Financials are based on the most recent Mortgage that was taken out on this home.
Original Mortgage
$99,200
Interest Rate
7.7%
Mortgage Type
Commercial
Create a Home Valuation Report for This Property
The Home Valuation Report is an in-depth analysis detailing your home's value as well as a comparison with similar homes in the area
Home Values in the Area
Average Home Value in this Area
Purchase History
| Date | Buyer | Sale Price | Title Company |
|---|---|---|---|
| Cupp Roy | $84,600 | -- | |
| Sherman Michael | $144,000 | Ticor Title | |
| Richmond Jason | $124,000 | Ticor Title |
Source: Public Records
Mortgage History
| Date | Status | Borrower | Loan Amount |
|---|---|---|---|
| Open | Cupp Roy | $92,383 | |
| Previous Owner | Sherman Michael | $115,200 | |
| Previous Owner | Richmond Jason | $99,200 | |
| Closed | Richmond Jason | $24,800 |
Source: Public Records
Tax History Compared to Growth
Tax History
| Year | Tax Paid | Tax Assessment Tax Assessment Total Assessment is a certain percentage of the fair market value that is determined by local assessors to be the total taxable value of land and additions on the property. | Land | Improvement |
|---|---|---|---|---|
| 2024 | $2,149 | $134,170 | $69,900 | $64,270 |
| 2023 | $2,117 | $130,270 | $66,000 | $64,270 |
| 2022 | $2,030 | $126,480 | $63,570 | $62,910 |
| 2021 | $1,854 | $122,800 | $60,740 | $62,060 |
| 2020 | $1,792 | $119,230 | $51,080 | $68,150 |
| 2019 | $1,764 | $115,760 | $49,160 | $66,600 |
| 2018 | $1,710 | $112,390 | $57,690 | $54,700 |
| 2017 | $1,662 | $109,120 | $56,010 | $53,110 |
| 2016 | $1,637 | $105,950 | $54,380 | $51,570 |
| 2015 | $1,389 | $93,010 | $53,450 | $39,560 |
| 2014 | $1,337 | $88,250 | $49,440 | $38,810 |
Source: Public Records
Map
Nearby Homes
- 0 S 13th St Unit 15 23587676
- 0 S 13th St Unit 14 23207570
- 1324 Old Portland Rd
- 465 S 9th St
- 344 S 15th St
- 614 S 10th St
- 615 S 9th St
- 285 S 7th St
- 280 S 18th St
- 297 S 6th St
- 215 S 8th St
- 445 S 4th St
- 234 N 15th St
- 155 S 8th St
- 9670 Parcel
- 270 Cowlitz St
- 144 S 6th St
- 134 S 6th St
- 284 N 17th St
- 80 S 21st St