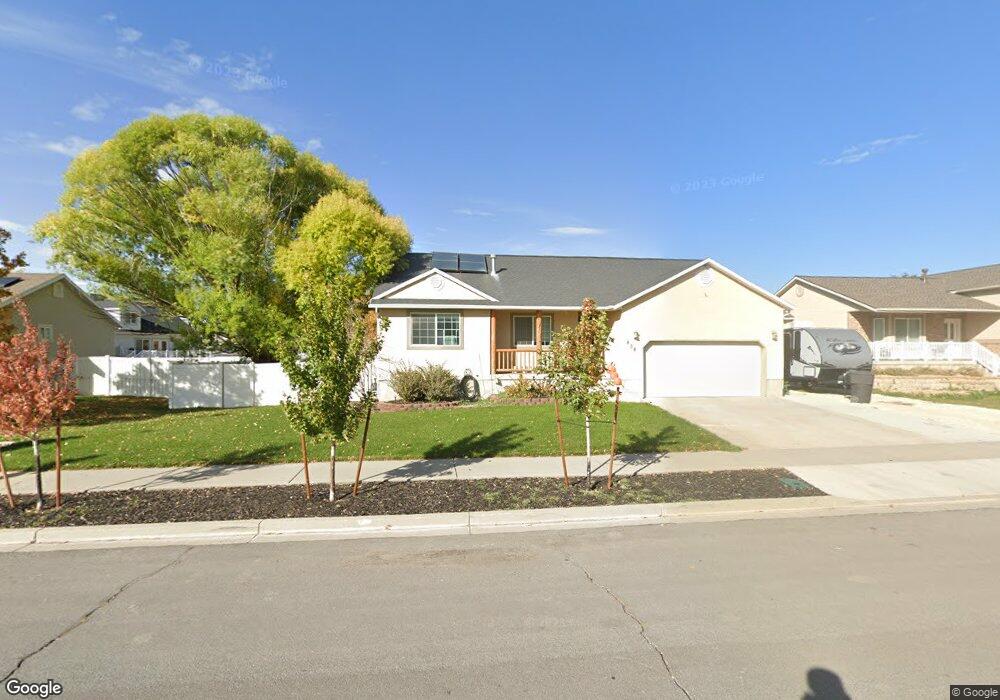
434 W 1500 S Payson, UT 84651
Estimated Value: $489,000 - $524,365
3
Beds
2
Baths
2,612
Sq Ft
$193/Sq Ft
Est. Value
About This Home
This home is located at 434 W 1500 S, Payson, UT 84651 and is currently estimated at $503,122, approximately $192 per square foot. 434 W 1500 S is a home located in Utah County with nearby schools including Spring Lake Elementary, Payson High School, and Payson Junior High School.
Ownership History
Date
Name
Owned For
Owner Type
Purchase Details
Closed on
May 13, 2020
Sold by
Schulz Jeffrey R and Schulz Lori Ki
Bought by
John Kip T and John Beverly
Current Estimated Value
Home Financials for this Owner
Home Financials are based on the most recent Mortgage that was taken out on this home.
Original Mortgage
$204,000
Outstanding Balance
$180,772
Interest Rate
3.3%
Mortgage Type
New Conventional
Estimated Equity
$322,350
Purchase Details
Closed on
Nov 25, 2003
Sold by
Schulz Jeffrey R and Schulz Jeffery R
Bought by
Schulz Jeffrey R and Schulz Lori K
Home Financials for this Owner
Home Financials are based on the most recent Mortgage that was taken out on this home.
Original Mortgage
$124,700
Interest Rate
6%
Mortgage Type
Purchase Money Mortgage
Purchase Details
Closed on
Mar 27, 2001
Sold by
Schultz Jeff
Bought by
Schultz Jeff
Purchase Details
Closed on
Apr 24, 2000
Sold by
Payson Dry Creek Llc
Bought by
Schultz Jeff
Create a Home Valuation Report for This Property
The Home Valuation Report is an in-depth analysis detailing your home's value as well as a comparison with similar homes in the area
Home Values in the Area
Average Home Value in this Area
Purchase History
| Date | Buyer | Sale Price | Title Company |
|---|---|---|---|
| John Kip T | -- | Inwest Title Orem | |
| Schulz Jeffrey R | -- | Pro Title & Escrow Inc | |
| Schultz Jeff | -- | Advantage Title | |
| Schultz Jeff | -- | Old Republic Title Company |
Source: Public Records
Mortgage History
| Date | Status | Borrower | Loan Amount |
|---|---|---|---|
| Open | John Kip T | $204,000 | |
| Previous Owner | Schulz Jeffrey R | $124,700 | |
| Closed | Schulz Jeffrey R | $10,300 |
Source: Public Records
Tax History
| Year | Tax Paid | Tax Assessment Tax Assessment Total Assessment is a certain percentage of the fair market value that is determined by local assessors to be the total taxable value of land and additions on the property. | Land | Improvement |
|---|---|---|---|---|
| 2025 | $2,488 | $270,985 | -- | -- |
| 2024 | $2,488 | $253,220 | $0 | $0 |
| 2023 | $2,516 | $256,795 | $0 | $0 |
| 2022 | $2,618 | $262,735 | $0 | $0 |
| 2021 | $1,973 | $317,700 | $115,100 | $202,600 |
| 2020 | $1,869 | $294,300 | $104,600 | $189,700 |
| 2019 | $1,711 | $276,300 | $86,600 | $189,700 |
| 2018 | $1,569 | $244,200 | $75,800 | $168,400 |
| 2017 | $1,434 | $120,010 | $0 | $0 |
| 2016 | $1,359 | $112,970 | $0 | $0 |
| 2015 | $1,250 | $103,235 | $0 | $0 |
| 2014 | $1,102 | $91,685 | $0 | $0 |
Source: Public Records
Map
Nearby Homes
- 1463 S 260 W
- 609 W Saddlebrook Dr
- 613 W Saddlebrook Dr
- 588 W 1450 S
- 32 E 1690 S Unit 113
- 347 W 1380 S
- 1872 100 E Unit 6
- 1631 S Highway 198
- 211 W 1800 S
- 1835 S 410 W
- 1848 S 410 W
- 1632 S 240 W Unit 47
- 1652 S 240 W Unit 48
- 802 Brookside Ct
- 1848 S 100 E Unit 3
- 528 W 1150 S
- 1579 S 910 W
- 1468 S 910 W
- 336 E 1330 S
- 389 E 1290 S
Your Personal Tour Guide
Ask me questions while you tour the home.