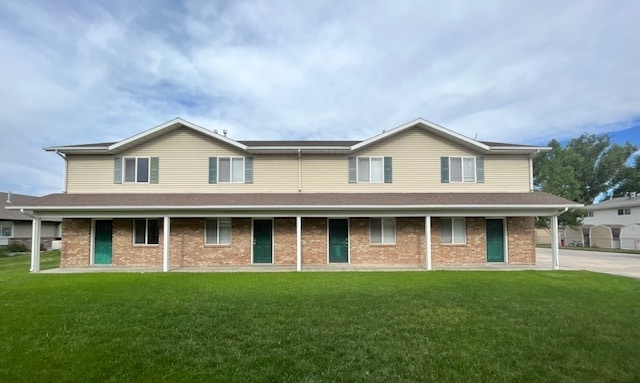
434 W 400 N Tremonton, UT 84337
2
Beds
1.5
Baths
1,175
Sq Ft
9,583
Sq Ft Lot
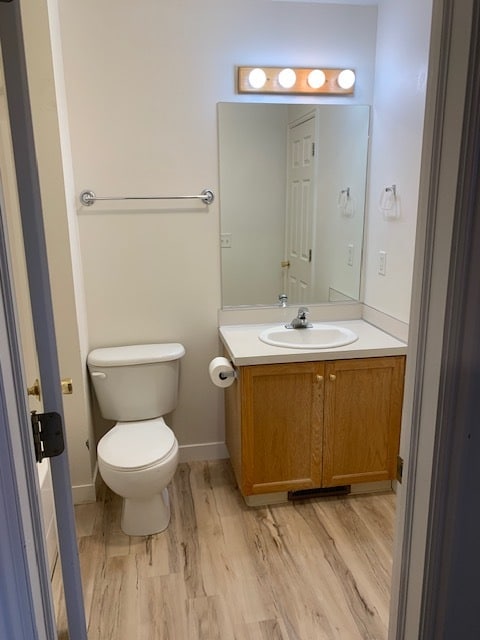
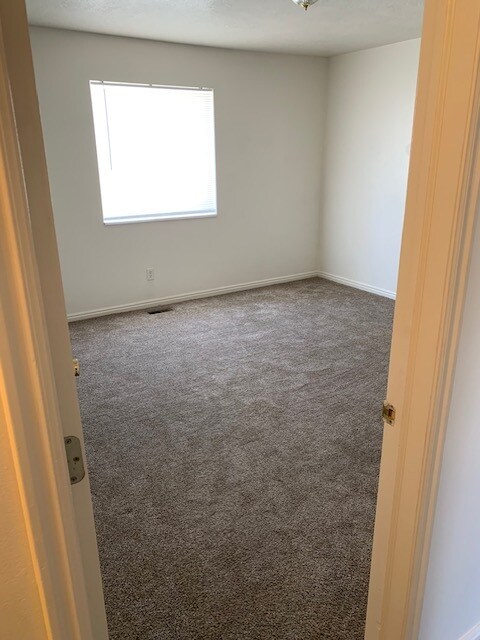
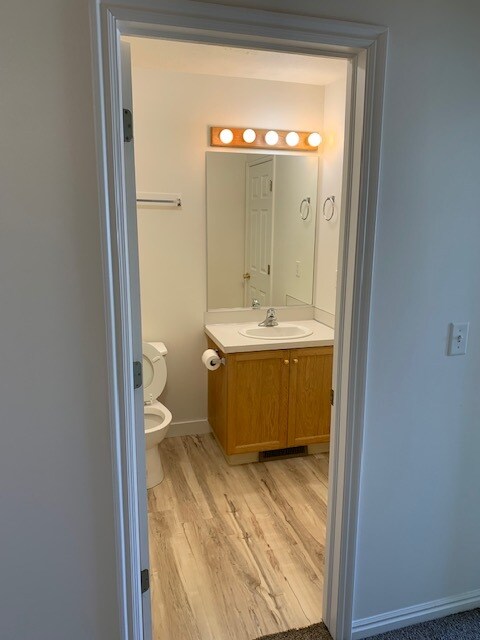
About This Home
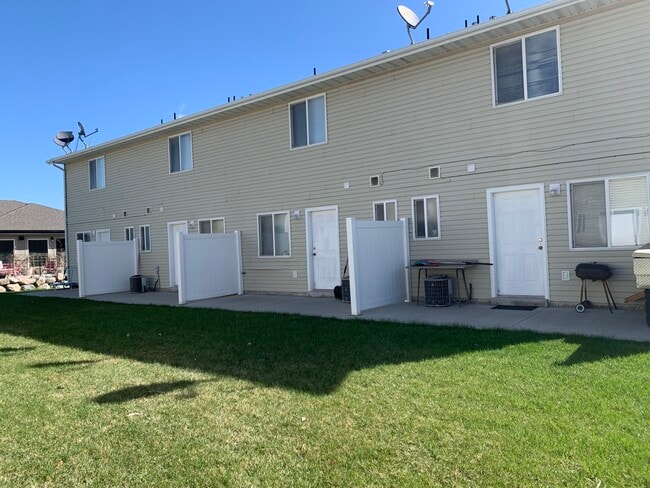
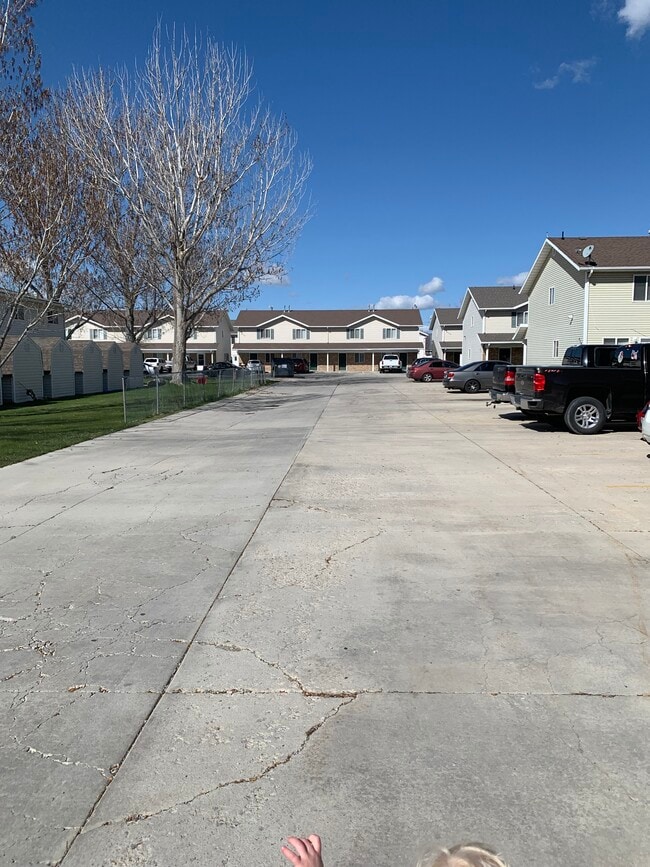
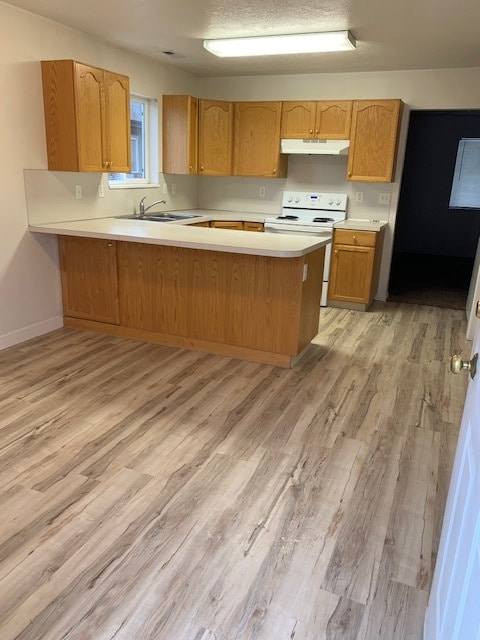
This apt is nice and very clean. Two parking spaces per apt. Great neighbors, two entrances. big bedrooms. walk in closet with shelves in master bedrm. Lawn area in front and back of apt. patio with privacy dividers. This is a clean well taken apt. complex. The manager is on top of it all and leaves no problem undone.
Listing Provided By

Map
Nearby Homes
- 327 N 400 W
- 931 W 910 N
- 678 600 W
- 688 600 W
- 711 N 600 W Unit 113
- 711 N 600 W
- 719 N 600 W Unit 112
- 719 N 600 W
- 725 N 600 W
- 725 N 600 W Unit 111
- 733 N 600 W Unit 110
- 678 N 600 W Unit 103
- 688 N 600 W Unit 104
- 696 N 600 W Unit 105
- 702 N 600 W Unit 106
- Lyndhurst Plan at Archibald Estates - Tremonton (Active Adult Homes)
- Hawthorne Plan at Envision Estates - Tremonton
- Lyndhurst Plan at Envision Estates - Tremonton
- Aberdeen Plan at Envision Estates - Tremonton
- Magnolia Plan at Envision Estates - Tremonton
- 245 N 400 W
- 10965 N Wallace Ln
- 5330 N Highway 38
- 945 W 2200 S
- 925 W 2075 S
- 994 W 3410 S
- 695 W 200 N
- 479 W Center St Unit Betty's Place
- 1501 Talon Dr Unit 1501 Talon Dr
- 505 W 1570 N
- 408 Spring Ln
- 426 W 200 S
- 1521 N 420 W
- 1693 N 400 W
- 296 W 1100 N Unit 1
- 267 W 1100 N Unit 3
- 87 E 300 S
- 94 W 100 S
- 351 W 1600 N
- 961 N 100 W