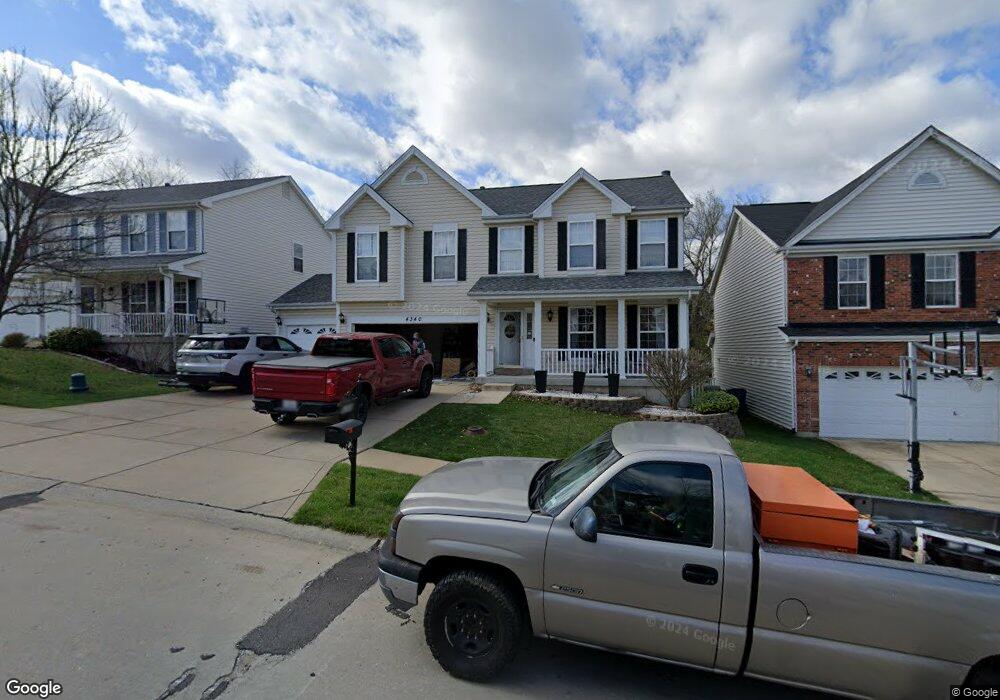
4340 Hawkins Glen Way Saint Louis, MO 63129
Estimated Value: $411,000 - $471,000
3
Beds
3
Baths
2,564
Sq Ft
$174/Sq Ft
Est. Value
About This Home
This home is located at 4340 Hawkins Glen Way, Saint Louis, MO 63129 and is currently estimated at $445,825, approximately $173 per square foot. 4340 Hawkins Glen Way is a home located in St. Louis County with nearby schools including Hagemann Elementary School, Washington Middle School, and Mehlville High School.
Ownership History
Date
Name
Owned For
Owner Type
Purchase Details
Closed on
Nov 6, 2009
Sold by
Crider Randall and Crider Jacqueline
Bought by
Crider Randall and Crider Jacqueline
Current Estimated Value
Home Financials for this Owner
Home Financials are based on the most recent Mortgage that was taken out on this home.
Original Mortgage
$20,000
Outstanding Balance
$5,882
Interest Rate
4.83%
Mortgage Type
Unknown
Estimated Equity
$439,943
Purchase Details
Closed on
Mar 7, 2008
Sold by
Murphy Richard G and Murphy Susan L
Bought by
Crider Randall
Home Financials for this Owner
Home Financials are based on the most recent Mortgage that was taken out on this home.
Original Mortgage
$219,300
Interest Rate
5.72%
Mortgage Type
Purchase Money Mortgage
Purchase Details
Closed on
May 23, 2002
Sold by
The Jones Company Custom Homes Inc
Bought by
Murphy Richard G and Murphy Susan L
Home Financials for this Owner
Home Financials are based on the most recent Mortgage that was taken out on this home.
Original Mortgage
$125,000
Interest Rate
6.96%
Create a Home Valuation Report for This Property
The Home Valuation Report is an in-depth analysis detailing your home's value as well as a comparison with similar homes in the area
Home Values in the Area
Average Home Value in this Area
Purchase History
| Date | Buyer | Sale Price | Title Company |
|---|---|---|---|
| Crider Randall | -- | Investors Title Company | |
| Crider Randall | $258,000 | Ort | |
| Murphy Richard G | -- | -- |
Source: Public Records
Mortgage History
| Date | Status | Borrower | Loan Amount |
|---|---|---|---|
| Open | Crider Randall | $20,000 | |
| Open | Crider Randall | $212,000 | |
| Closed | Crider Randall | $219,300 | |
| Previous Owner | Murphy Richard G | $125,000 |
Source: Public Records
Tax History Compared to Growth
Tax History
| Year | Tax Paid | Tax Assessment Tax Assessment Total Assessment is a certain percentage of the fair market value that is determined by local assessors to be the total taxable value of land and additions on the property. | Land | Improvement |
|---|---|---|---|---|
| 2025 | $4,507 | $73,890 | $15,710 | $58,180 |
| 2024 | $4,507 | $67,180 | $11,780 | $55,400 |
| 2023 | $4,450 | $67,180 | $11,780 | $55,400 |
| 2022 | $3,876 | $58,780 | $10,220 | $48,560 |
| 2021 | $3,751 | $58,780 | $10,220 | $48,560 |
| 2020 | $3,786 | $56,440 | $8,650 | $47,790 |
| 2019 | $3,775 | $56,440 | $8,650 | $47,790 |
| 2018 | $3,664 | $49,460 | $7,870 | $41,590 |
| 2017 | $3,659 | $49,460 | $7,870 | $41,590 |
| 2016 | $3,408 | $44,180 | $7,870 | $36,310 |
| 2015 | $3,129 | $44,180 | $7,870 | $36,310 |
| 2014 | $3,078 | $43,020 | $13,360 | $29,660 |
Source: Public Records
Map
Nearby Homes
- 5942 Hawkins Fuchs Rd
- 4423 Saddleridge Farm Dr
- 5968 Southcrest Way
- 4330 Canyonside Ln
- 5600 Wickershire Ln
- 5703 Lilac Trails Dr
- 6055 Bayou Bend Ct
- 4357 Bristol View Ct
- 4374 Bristol View Ct
- 5714 Shining Day Place
- 4305 Grand Marnier Dr
- 4251 Green Grove Ct
- 5524 Providence Place Dr
- 4523 Beaver Brook Ct
- 5827 Bridleford Ln
- 5896 Rockland Ln
- 5824 Bridleford Ln
- 5417 Morningdale Place
- 5812 Chrisbrook Dr
- 4706 Mcilroy Dr
- 4336 Hawkins Glen Way
- 4348 Hawkins Glen Way
- 4332 Hawkins Glen Way
- 4309 Hawkins Ridge Dr
- 4328 Hawkins Glen Way
- 4352 Hawkins Glen Way
- 4313 Hawkins Ridge Dr
- 4345 Hawkins Glen Way
- 4341 Hawkins Glen Way
- 4349 Hawkins Glen Way
- 4305 Hawkins Ridge (Lot 47) Dr
- 4305 Hawkins Ridge Dr
- 4305 Hawkins Ridge Dr
- 0TBB Kennesaw at Hawkins Ridge
- 4337 Hawkins Glen Way
- 0TBB Portsmouth at Hawkins Ridge
- 0TBB the Portsmouth @ Hawkins Ridge
- 0TBB Sheridan at Hawkins Ridge
- 4353 Hawkins Glen Way
- 4356 Hawkins Glen Way