Estimated Value: $185,000 - $220,000
3
Beds
1
Bath
1,238
Sq Ft
$167/Sq Ft
Est. Value
About This Home
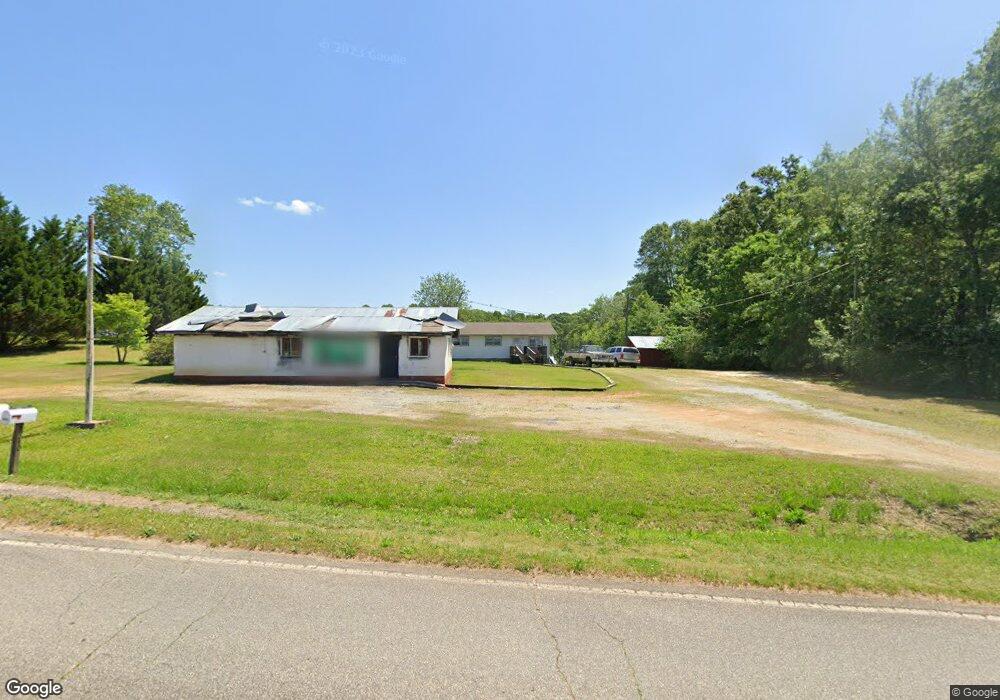
This home is located at 4340 Old Highway 441 N, Alto, GA 30510 and is currently estimated at $207,300, approximately $167 per square foot. 4340 Old Highway 441 N is a home located in Banks County with nearby schools including Banks County Primary School, Banks County Elementary School, and Banks County Middle School.
Ownership History
Date
Name
Owned For
Owner Type
Purchase Details
Closed on
Jul 19, 2019
Sold by
Ward Gina Ann
Bought by
Chapman Justin G and Chapman Heather C
Current Estimated Value
Home Financials for this Owner
Home Financials are based on the most recent Mortgage that was taken out on this home.
Original Mortgage
$86,381
Outstanding Balance
$75,483
Interest Rate
3.8%
Mortgage Type
New Conventional
Estimated Equity
$131,817
Purchase Details
Closed on
Nov 16, 2009
Sold by
Hsbc Mortgage Services Inc
Bought by
Ward Gina Ann
Purchase Details
Closed on
Jun 2, 2009
Sold by
Free Victoria E
Bought by
Hsbc Mortgage Services
Purchase Details
Closed on
Jun 28, 2006
Sold by
Ayers Dean James
Bought by
Free William D and Free Victoria E
Home Financials for this Owner
Home Financials are based on the most recent Mortgage that was taken out on this home.
Original Mortgage
$105,300
Interest Rate
6.6%
Mortgage Type
New Conventional
Create a Home Valuation Report for This Property
The Home Valuation Report is an in-depth analysis detailing your home's value as well as a comparison with similar homes in the area
Home Values in the Area
Average Home Value in this Area
Purchase History
| Date | Buyer | Sale Price | Title Company |
|---|---|---|---|
| Chapman Justin G | $79,800 | -- | |
| Ward Gina Ann | $31,000 | -- | |
| Hsbc Mortgage Services | $50,050 | -- | |
| Free William D | $105,300 | -- |
Source: Public Records
Mortgage History
| Date | Status | Borrower | Loan Amount |
|---|---|---|---|
| Open | Chapman Justin G | $86,381 | |
| Previous Owner | Free William D | $105,300 |
Source: Public Records
Tax History Compared to Growth
Tax History
| Year | Tax Paid | Tax Assessment Tax Assessment Total Assessment is a certain percentage of the fair market value that is determined by local assessors to be the total taxable value of land and additions on the property. | Land | Improvement |
|---|---|---|---|---|
| 2025 | $1,184 | $67,905 | $11,111 | $56,794 |
| 2024 | $1,184 | $64,036 | $10,101 | $53,935 |
| 2023 | $1,222 | $50,312 | $10,025 | $40,287 |
| 2022 | $875 | $43,636 | $9,673 | $33,963 |
| 2021 | $798 | $37,733 | $6,661 | $31,072 |
| 2020 | $686 | $32,405 | $5,598 | $26,807 |
| 2019 | $647 | $28,058 | $5,598 | $22,460 |
| 2018 | $628 | $26,786 | $4,306 | $22,480 |
| 2017 | $643 | $26,299 | $3,744 | $22,555 |
| 2016 | $661 | $26,299 | $3,744 | $22,555 |
| 2015 | $671 | $26,299 | $3,744 | $22,555 |
| 2014 | $671 | $28,431 | $5,876 | $22,555 |
| 2013 | -- | $28,430 | $5,876 | $22,554 |
Source: Public Records
Map
Nearby Homes
- 0 Soapstone Rd Unit 7646343
- 0 Soapstone Rd Unit 10600294
- 209 Alice Moss Ln
- 340 Daily Rd
- 113 Wynn Wood Ln
- 0 Wynn Lake Rd Unit 10640622
- 750 Rock Springs Rd
- 535 Otis Brown Rd
- 157 Peachwood Ln
- 149 Peachwood Ln
- 0 Whippoorwill Terrace Unit 10552744
- 0 Whippoorwill Terrace Unit 7605702
- LOT 26 Whippoorwill Way
- 136 Lakeview Way
- 716 Hawkins Rd
- 382 Simmons Rd
- 01 Planters Pointe Dr
- 0 Planters Pointe Dr Unit 10636110
- 0 Planters Pointe Ln Unit 10620249
- 0 Planters Creek Dr Unit Lot 34 CM1024458
- 4340 Highway 441 Bypass
- 4366 Old Highway 441 N
- 4366 Highway 441 Bypass
- 4308 Old Highway 441 N
- 4230 Highway 441 Bypass
- 4230 Old Highway 441 N
- 4289 Highway 441 Bypass
- 4228 Old Highway 441 N
- 4441 Old Highway 441 N
- 4289 Old Highway 441 N
- 4414 Old Highway 441 N
- 4513 Old Highway 441 N
- 4222 Old Highway 441 N
- 4231 Old Highway 441 N
- 4188 Old Highway 441 N
- 167 Moss Mill Rd
- 129 Moss Mill Rd
- 4496 Old Highway 441 N
- 4199 Highway 441 Bypass
- 0 Old Hwy 441 Unit 7329292