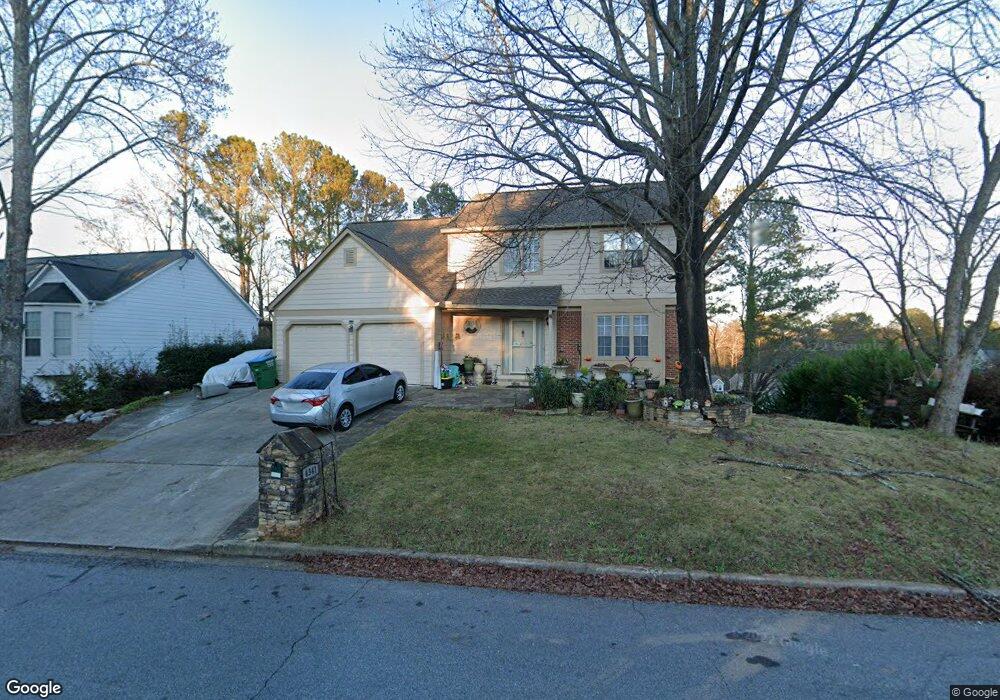
4341 E Meadow Dr Unit 2 Duluth, GA 30096
Estimated Value: $383,000 - $435,000
3
Beds
3
Baths
2,215
Sq Ft
$188/Sq Ft
Est. Value
About This Home
This home is located at 4341 E Meadow Dr Unit 2, Duluth, GA 30096 and is currently estimated at $416,125, approximately $187 per square foot. 4341 E Meadow Dr Unit 2 is a home located in Gwinnett County with nearby schools including Charles Brant Chesney Elementary School, Duluth Middle School, and Duluth High School.
Ownership History
Date
Name
Owned For
Owner Type
Purchase Details
Closed on
Apr 21, 2004
Sold by
Joshi Anand P
Bought by
Uscanga Christina
Current Estimated Value
Home Financials for this Owner
Home Financials are based on the most recent Mortgage that was taken out on this home.
Original Mortgage
$157,100
Outstanding Balance
$71,772
Interest Rate
5.35%
Mortgage Type
New Conventional
Estimated Equity
$344,353
Purchase Details
Closed on
Jun 5, 2000
Sold by
Ross D'Narda
Bought by
Hamlen James C
Home Financials for this Owner
Home Financials are based on the most recent Mortgage that was taken out on this home.
Original Mortgage
$143,715
Interest Rate
8.11%
Mortgage Type
FHA
Purchase Details
Closed on
May 19, 2000
Sold by
Joshi Anand P
Bought by
Joshi Anand P
Home Financials for this Owner
Home Financials are based on the most recent Mortgage that was taken out on this home.
Original Mortgage
$143,715
Interest Rate
8.11%
Mortgage Type
FHA
Create a Home Valuation Report for This Property
The Home Valuation Report is an in-depth analysis detailing your home's value as well as a comparison with similar homes in the area
Home Values in the Area
Average Home Value in this Area
Purchase History
| Date | Buyer | Sale Price | Title Company |
|---|---|---|---|
| Uscanga Christina | $162,000 | -- | |
| Hamlen James C | -- | -- | |
| Joshi Anand P | -- | -- | |
| Joshi Anand P | $144,900 | -- |
Source: Public Records
Mortgage History
| Date | Status | Borrower | Loan Amount |
|---|---|---|---|
| Open | Uscanga Christina | $157,100 | |
| Previous Owner | Joshi Anand P | $143,715 |
Source: Public Records
Tax History Compared to Growth
Tax History
| Year | Tax Paid | Tax Assessment Tax Assessment Total Assessment is a certain percentage of the fair market value that is determined by local assessors to be the total taxable value of land and additions on the property. | Land | Improvement |
|---|---|---|---|---|
| 2025 | $5,060 | $195,920 | $27,880 | $168,040 |
| 2024 | $4,986 | $186,240 | $28,800 | $157,440 |
| 2023 | $4,986 | $183,080 | $24,000 | $159,080 |
| 2022 | $4,452 | $162,160 | $24,000 | $138,160 |
| 2021 | $3,664 | $121,040 | $18,000 | $103,040 |
| 2020 | $3,520 | $113,080 | $16,000 | $97,080 |
| 2019 | $3,438 | $113,080 | $16,000 | $97,080 |
| 2018 | $3,175 | $100,760 | $16,000 | $84,760 |
| 2016 | $2,803 | $82,600 | $13,800 | $68,800 |
| 2015 | $2,650 | $74,600 | $12,000 | $62,600 |
| 2014 | $2,492 | $66,840 | $11,200 | $55,640 |
Source: Public Records
Map
Nearby Homes
- 3945 Genoa Ct
- 4220 E Meadow Dr
- 4110 Megan Rd Unit 2
- 3980 Howell Park Rd
- 2531 Inverloch Cir
- 3969 Leeward Ct Unit 4
- 4001 Howell Park Rd
- 2535 Rhoanoke Dr
- 2935 Landington Way
- 2865 Landington Way
- 2377 Fawn Hollow Ct
- 4300 Wildridge Dr
- 4091 Beaver Oaks Dr
- 4328 Buckingham Place
- 2347 Fawn Hollow Ct Unit 1
- 4368 Buckingham Place
- 2638 Village Park Bend
- 2590 Village Place Dr
- 4136 Buford Hwy
- 4196 Buford Hwy
- 4351 E Meadow Dr
- 4351 E Meadow Dr Unit 2
- 3995 Blackburn Way
- 4321 E Meadow Dr
- 4361 E Meadow Dr
- 3985 Blackburn Way Unit 2
- 4030 Angora Place
- 4330 E Meadow Dr Unit 2
- 3990 Blackburn Way
- 4340 E Meadow Dr
- 4320 E Meadow Dr
- 4350 E Meadow Dr Unit 2
- 4311 E Meadow Dr
- 3980 Blackburn Way Unit 2
- 3965 Blackburn Way Unit 2
- 4310 E Meadow Dr
- 4020 Angora Place
- 4360 E Meadow Dr
- 4301 E Meadow Dr
- 3970 Blackburn Way