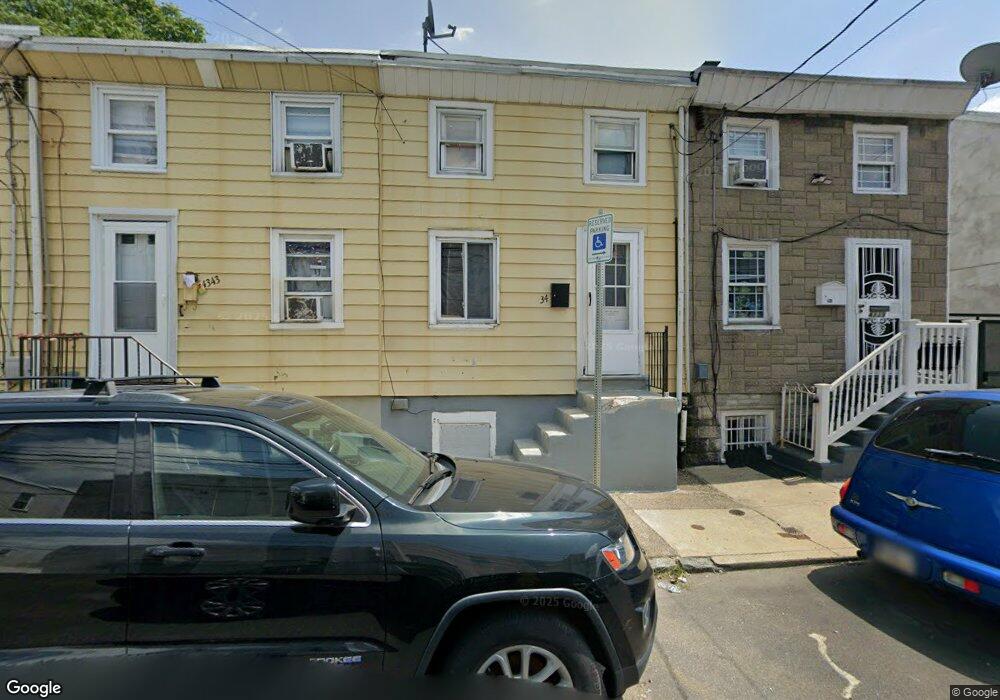
4341 Leiper St Philadelphia, PA 19124
Frankford NeighborhoodEstimated Value: $89,000 - $110,000
2
Beds
1
Bath
868
Sq Ft
$116/Sq Ft
Est. Value
About This Home
This home is located at 4341 Leiper St, Philadelphia, PA 19124 and is currently estimated at $100,891, approximately $116 per square foot. 4341 Leiper St is a home located in Philadelphia County with nearby schools including John Marshall School, Harding Warren G Middle School, and Frankford High School.
Ownership History
Date
Name
Owned For
Owner Type
Purchase Details
Closed on
Mar 19, 2010
Sold by
Moly Varkey Jose and Moly Jose
Bought by
Velazquez Ricardo
Current Estimated Value
Purchase Details
Closed on
Mar 11, 2010
Sold by
Rose Land & Finance Corp
Bought by
Moly Varkey Jose and Moly Jose
Purchase Details
Closed on
Mar 1, 2010
Sold by
Rose Acceptance Inc
Bought by
Rose Land & Finance Corp
Purchase Details
Closed on
Feb 9, 2009
Sold by
Estate Of George White
Bought by
Rose Acceptance Inc
Purchase Details
Closed on
Jan 14, 2000
Sold by
Builders Of The Future
Bought by
White George and White Regina
Home Financials for this Owner
Home Financials are based on the most recent Mortgage that was taken out on this home.
Original Mortgage
$31,500
Interest Rate
7.09%
Mortgage Type
Seller Take Back
Purchase Details
Closed on
Feb 4, 1999
Sold by
Wilz Christine E and Will Of Eleanor Wilz
Bought by
Builders Of The Future
Create a Home Valuation Report for This Property
The Home Valuation Report is an in-depth analysis detailing your home's value as well as a comparison with similar homes in the area
Home Values in the Area
Average Home Value in this Area
Purchase History
| Date | Buyer | Sale Price | Title Company |
|---|---|---|---|
| Velazquez Ricardo | $22,000 | None Available | |
| Moly Varkey Jose | $16,000 | None Available | |
| Rose Land & Finance Corp | $14,100 | None Available | |
| Rose Acceptance Inc | $25,000 | None Available | |
| White George | $35,000 | -- | |
| Builders Of The Future | $10,000 | -- |
Source: Public Records
Mortgage History
| Date | Status | Borrower | Loan Amount |
|---|---|---|---|
| Previous Owner | White George | $31,500 | |
| Closed | White George | $1,750 |
Source: Public Records
Tax History Compared to Growth
Tax History
| Year | Tax Paid | Tax Assessment Tax Assessment Total Assessment is a certain percentage of the fair market value that is determined by local assessors to be the total taxable value of land and additions on the property. | Land | Improvement |
|---|---|---|---|---|
| 2026 | $848 | $98,000 | $19,600 | $78,400 |
| 2025 | $848 | $98,000 | $19,600 | $78,400 |
| 2024 | $848 | $98,000 | $19,600 | $78,400 |
| 2023 | $848 | $60,600 | $12,120 | $48,480 |
| 2022 | $218 | $15,600 | $12,120 | $3,480 |
| 2021 | $683 | $0 | $0 | $0 |
| 2020 | $683 | $0 | $0 | $0 |
| 2019 | $657 | $0 | $0 | $0 |
| 2018 | $791 | $0 | $0 | $0 |
| 2017 | $791 | $0 | $0 | $0 |
| 2016 | $791 | $0 | $0 | $0 |
| 2015 | $757 | $0 | $0 | $0 |
| 2014 | -- | $56,500 | $17,710 | $38,790 |
| 2012 | -- | $4,608 | $614 | $3,994 |
Source: Public Records
Map
Nearby Homes
- 4328 Leiper St
- 1417 Unity St
- 1419 Unity St
- 1319 Church St
- 4461 Leiper St
- 1348 Sellers St
- 1424 Sellers St
- 1338-40 Sellers St
- 1337 Sellers St
- 1361 Sellers St
- 4742 Frankford Ave
- 4431 Oakland St
- 4405 Frankford Ave
- 1208 Unity St
- 4283 Frankford Ave
- 1501 Womrath St
- 4361 Frankford Ave
- 1519 Womrath St
- 4347 Paul St
- 4229 Griscom St
- 4343 Leiper St
- 4339 Leiper St
- 4345 Leiper St
- 4337 Leiper St
- 4360 62 Leiper St
- 4347 Leiper St
- 4349 Leiper St
- 4335 Leiper St
- 4333 Leiper St
- 4346 Leiper St
- 4344 Leiper St
- 4340 Leiper St
- 4319 Leiper St Unit 27
- 4354 Leiper St
- 4338 Leiper St
- 4356 Leiper St Unit 58
- 4332 Leiper St
- 4334 Leiper St
- 4366 Leiper St
- 4360 Leiper St Unit 62