4341 Regency Ridge Ct Unit 105 Cincinnati, OH 45248
Estimated Value: $180,000 - $187,000
2
Beds
2
Baths
1,257
Sq Ft
$146/Sq Ft
Est. Value
About This Home
This home is located at 4341 Regency Ridge Ct Unit 105, Cincinnati, OH 45248 and is currently estimated at $183,529, approximately $146 per square foot. 4341 Regency Ridge Ct Unit 105 is a home located in Hamilton County with nearby schools including Oakdale Elementary School, Bridgetown Middle School, and Oak Hills High School.
Ownership History
Date
Name
Owned For
Owner Type
Purchase Details
Closed on
Sep 18, 2019
Sold by
Hoffman Eugene David
Bought by
Mock Rodney T and Frazer Nancy M
Current Estimated Value
Home Financials for this Owner
Home Financials are based on the most recent Mortgage that was taken out on this home.
Original Mortgage
$87,200
Outstanding Balance
$76,380
Interest Rate
3.6%
Mortgage Type
Purchase Money Mortgage
Estimated Equity
$107,149
Purchase Details
Closed on
Mar 13, 2014
Sold by
Estate Of Wilma R Hoffman
Bought by
Hoffman Eugene David
Purchase Details
Closed on
Aug 15, 2006
Sold by
Doyle Michael L
Bought by
Hoffman Wilma R
Purchase Details
Closed on
Sep 28, 2005
Sold by
Lentz Daniel A
Bought by
Doyle Joan M
Purchase Details
Closed on
Dec 19, 1994
Sold by
Hal Homes Ltd Partnership 2
Bought by
Lentz Adrian J and Lentz Martha F
Create a Home Valuation Report for This Property
The Home Valuation Report is an in-depth analysis detailing your home's value as well as a comparison with similar homes in the area
Home Values in the Area
Average Home Value in this Area
Purchase History
| Date | Buyer | Sale Price | Title Company |
|---|---|---|---|
| Mock Rodney T | $109,000 | None Available | |
| Hoffman Eugene David | -- | None Available | |
| Hoffman Wilma R | -- | None Available | |
| Doyle Joan M | $116,500 | None Available | |
| Lentz Adrian J | -- | -- |
Source: Public Records
Mortgage History
| Date | Status | Borrower | Loan Amount |
|---|---|---|---|
| Open | Mock Rodney T | $87,200 |
Source: Public Records
Tax History Compared to Growth
Tax History
| Year | Tax Paid | Tax Assessment Tax Assessment Total Assessment is a certain percentage of the fair market value that is determined by local assessors to be the total taxable value of land and additions on the property. | Land | Improvement |
|---|---|---|---|---|
| 2024 | $2,754 | $54,138 | $7,000 | $47,138 |
| 2023 | $2,753 | $54,138 | $7,000 | $47,138 |
| 2022 | $2,291 | $38,150 | $4,445 | $33,705 |
| 2021 | $2,060 | $38,150 | $4,445 | $33,705 |
| 2020 | $2,084 | $38,150 | $4,445 | $33,705 |
| 2019 | $1,637 | $26,474 | $3,500 | $22,974 |
| 2018 | $1,639 | $26,474 | $3,500 | $22,974 |
| 2017 | $1,565 | $26,474 | $3,500 | $22,974 |
| 2016 | $1,546 | $25,830 | $5,166 | $20,664 |
| 2015 | $1,538 | $25,830 | $5,166 | $20,664 |
| 2014 | $973 | $25,830 | $5,166 | $20,664 |
| 2013 | $1,211 | $31,500 | $6,300 | $25,200 |
Source: Public Records
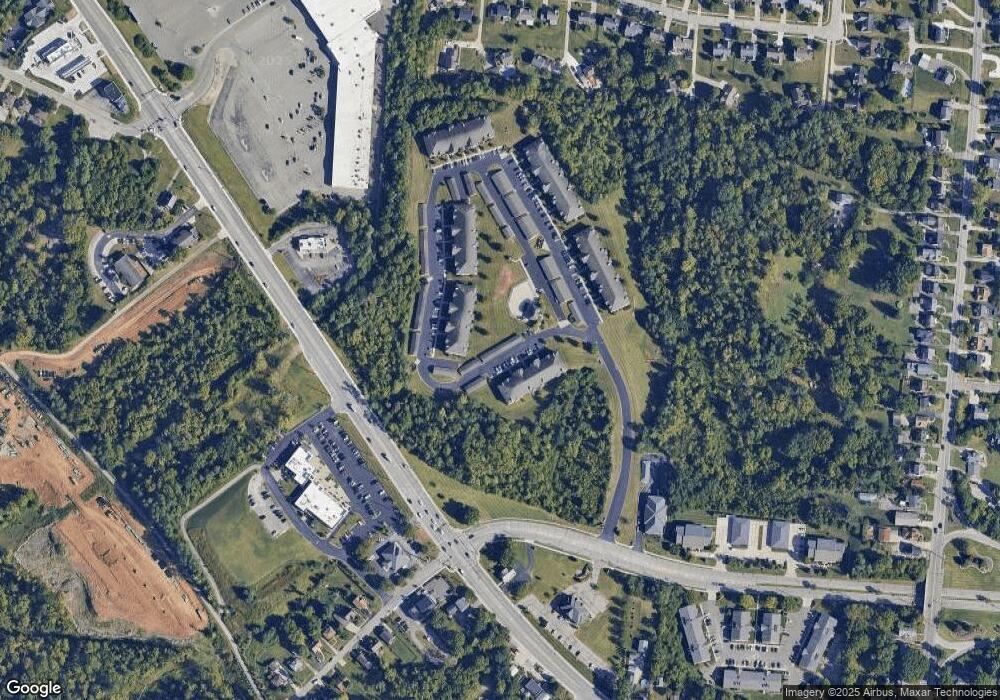
Map
Nearby Homes
- 4008 Trailside Dr
- 4017 Trailside Dr
- 3986 Trailside Dr
- 5648 Ohio Trail
- 5686 Ohio Trail
- 5690 Ohio Trail
- 5694 Ohio Trail
- 4012 Trailside Dr
- 5703 Irwin Dr
- 5682 Ohio Trail
- 4033 Trailside Dr
- 3994 Trailside Dr
- 5636 Ohio Trail
- 5640 Ohio Trail
- 5677 Ohio Trail
- 5689 Ohio Trail
- 5685 Ohio Trail
- 4310 Regency Ridge Ct
- 4341 Regency Ridge Ct Unit 208
- 4341 Regency Ridge Ct Unit 206
- 4341 Regency Ridge Ct Unit 203
- 4341 Regency Ridge Ct Unit 305
- 4341 Regency Ridge Ct
- 4341 Regency Ridge Ct
- 4341 Regency Ridge Ct
- 4341 Regency Ridge Ct
- 4341 Regency Ridge Ct
- 4341 Regency Ridge Ct
- 4341 Regency Ridge Ct
- 4341 Regency Ridge Ct
- 4341 Regency Ridge Ct
- 4341 Regency Ridge Ct
- 4341 Regency Ridge Ct
- 4341 Regency Ridge Ct
- 4341 Regency Ridge Ct
- 4341 Regency Ridge Ct
- 4341 Regency Ridge Ct
- 4341 Regency Ridge Ct