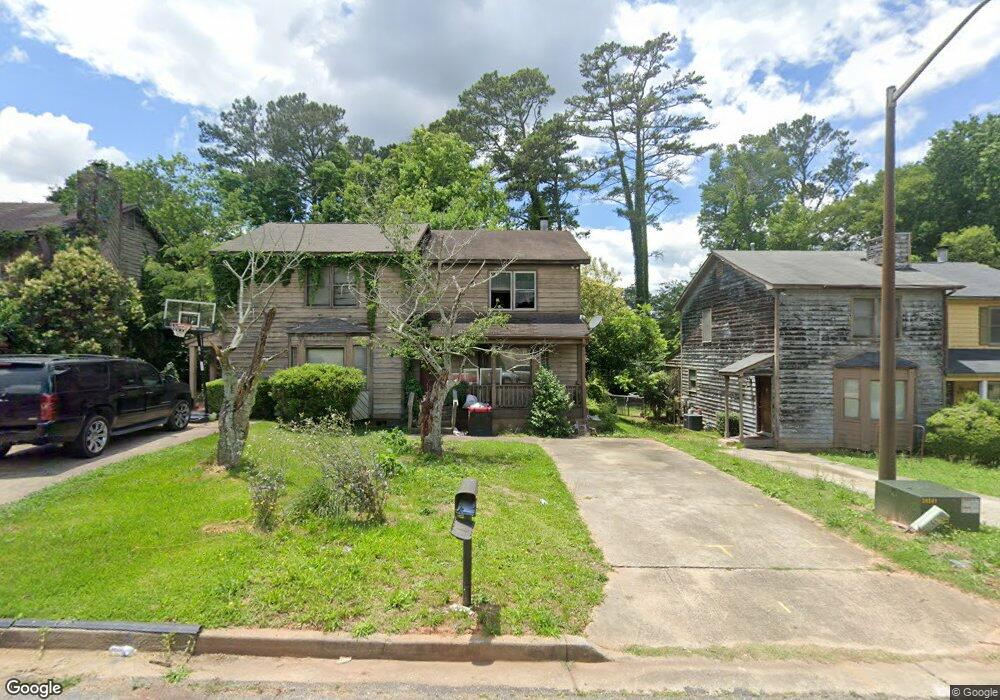
4342 Barrington Place Macon, GA 31210
Estimated Value: $105,000 - $138,000
2
Beds
2
Baths
1,092
Sq Ft
$107/Sq Ft
Est. Value
About This Home
This home is located at 4342 Barrington Place, Macon, GA 31210 and is currently estimated at $116,851, approximately $107 per square foot. 4342 Barrington Place is a home located in Bibb County with nearby schools including Carter Elementary School, Howard Middle School, and Howard High School.
Ownership History
Date
Name
Owned For
Owner Type
Purchase Details
Closed on
Feb 25, 2025
Sold by
Alr Real Estate Llc
Bought by
Aldo Investments Llc
Current Estimated Value
Purchase Details
Closed on
Feb 23, 2025
Sold by
Unleash-It Llc
Bought by
Alr Real Estate Llc
Purchase Details
Closed on
Feb 16, 2024
Sold by
Stallams Llc
Bought by
Unleash-It Llc
Purchase Details
Closed on
Jul 22, 2022
Sold by
Al & R Real Estate Llc
Bought by
Stallams Llc
Purchase Details
Closed on
Nov 12, 2021
Sold by
Al & R Real Estate Llc
Bought by
Junham Llc
Purchase Details
Closed on
Nov 10, 2021
Sold by
Agnello Louis
Bought by
Lish Investment Llc
Purchase Details
Closed on
Sep 13, 2000
Sold by
Tanner Lena Virginia Cloud
Bought by
Moore Lesteene M
Create a Home Valuation Report for This Property
The Home Valuation Report is an in-depth analysis detailing your home's value as well as a comparison with similar homes in the area
Home Values in the Area
Average Home Value in this Area
Purchase History
| Date | Buyer | Sale Price | Title Company |
|---|---|---|---|
| Aldo Investments Llc | $90,000 | None Listed On Document | |
| Aldo Investments Llc | $90,000 | None Listed On Document | |
| Alr Real Estate Llc | -- | None Listed On Document | |
| Unleash-It Llc | $118,000 | None Listed On Document | |
| Stallams Llc | $130,000 | None Listed On Document | |
| Al & R Real Estate Llc | $115,000 | Lighthouse Law Firm Llc | |
| Junham Llc | $105,000 | None Available | |
| Al & R Real Estate Llc | $70,000 | None Available | |
| Lish Investment Llc | $42,500 | None Available | |
| Moore Lesteene M | $44,900 | -- |
Source: Public Records
Tax History Compared to Growth
Tax History
| Year | Tax Paid | Tax Assessment Tax Assessment Total Assessment is a certain percentage of the fair market value that is determined by local assessors to be the total taxable value of land and additions on the property. | Land | Improvement |
|---|---|---|---|---|
| 2025 | $749 | $30,483 | $3,400 | $27,083 |
| 2024 | $774 | $30,483 | $3,400 | $27,083 |
| 2023 | $825 | $32,489 | $3,400 | $29,089 |
| 2022 | $790 | $22,825 | $3,400 | $19,425 |
| 2021 | $348 | $16,160 | $2,400 | $13,760 |
| 2020 | $356 | $16,160 | $2,400 | $13,760 |
| 2019 | $359 | $16,160 | $2,400 | $13,760 |
| 2018 | $511 | $12,518 | $2,400 | $10,118 |
| 2017 | $207 | $12,518 | $2,400 | $10,118 |
| 2016 | $191 | $12,518 | $2,400 | $10,118 |
| 2015 | $271 | $12,518 | $2,400 | $10,118 |
| 2014 | $362 | $12,518 | $2,400 | $10,118 |
Source: Public Records
Map
Nearby Homes
- 4571 Shadow Lawn Dr
- 4373 Barrington Place
- 4403 Azalea Dr
- 4532 Ayers Rd
- 3949 Bernice Ave
- 4433 Azalea Dr
- 1402 Barrington Place
- 1406 Barrington Place
- 4508 Bon Ayer Cir
- 162 Parkwood Ave
- 3848 Berkley Dr
- 3940 Grand Ave
- 4057 Brookdale Ave
- 3831 Fairmont Ave
- 209 Forest Hill Rd
- 3698 Berkley Dr
- 227 Forest Hill Rd
- 4058 Brookdale Ave
- 3861 Grand Ave
- 534 Ivy Brook Way
- 4344 Barrington Place
- 4340 Barrington Place
- 4338 Barrington Place
- 4346 Barrington Place
- 4336 Barrington Place
- 4348 Barrington Place
- 4350 Barrington Place
- 4334 Barrington Place
- 4523 Shadow Lawn Dr
- 4352 Barrington Place
- 4535 Shadow Lawn Dr
- 4332 Barrington Place
- 4341 Barrington Place
- 4343 Barrington Place
- 4339 Barrington Place
- 4345 Barrington Place
- 4511 Shadow Lawn Dr
- 4337 Barrington Place
- 4356 Barrington Place
- 4335 Barrington Place