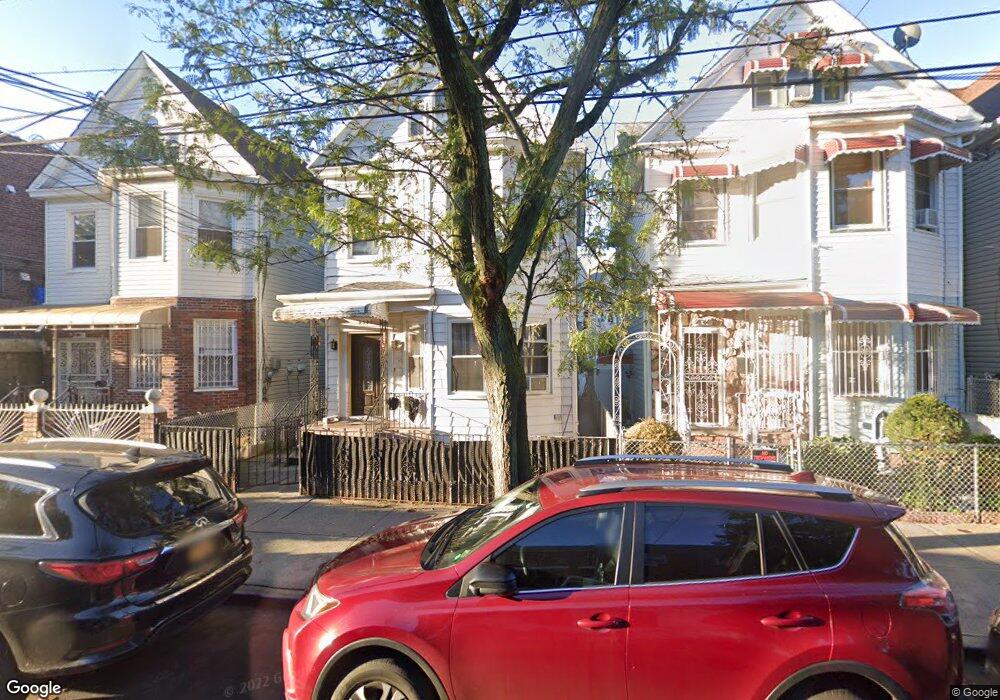
4342 Elbertson St Elmhurst, NY 11373
Elmhurst NeighborhoodEstimated Value: $1,039,165 - $1,368,000
--
Bed
--
Bath
1,848
Sq Ft
$640/Sq Ft
Est. Value
About This Home
This home is located at 4342 Elbertson St, Elmhurst, NY 11373 and is currently estimated at $1,182,291, approximately $639 per square foot. 4342 Elbertson St is a home located in Queens County with nearby schools including P.S. 110, Is 61 Leonardo Da Vinci, and Newtown High School.
Ownership History
Date
Name
Owned For
Owner Type
Purchase Details
Closed on
Mar 8, 2013
Sold by
Cobena Humberto and Pabon Jeanette
Bought by
Huang Ruixiang
Current Estimated Value
Purchase Details
Closed on
Sep 20, 2000
Sold by
Cobena Humberto and Hernandez Maritza
Bought by
Cobena Humberto and Pabon Jeanette
Home Financials for this Owner
Home Financials are based on the most recent Mortgage that was taken out on this home.
Original Mortgage
$164,813
Interest Rate
7.83%
Create a Home Valuation Report for This Property
The Home Valuation Report is an in-depth analysis detailing your home's value as well as a comparison with similar homes in the area
Home Values in the Area
Average Home Value in this Area
Purchase History
| Date | Buyer | Sale Price | Title Company |
|---|---|---|---|
| Huang Ruixiang | $505,000 | -- | |
| Huang Ruixiang | $505,000 | -- | |
| Cobena Humberto | -- | -- | |
| Cobena Humberto | -- | -- |
Source: Public Records
Mortgage History
| Date | Status | Borrower | Loan Amount |
|---|---|---|---|
| Previous Owner | Cobena Humberto | $164,813 |
Source: Public Records
Tax History Compared to Growth
Tax History
| Year | Tax Paid | Tax Assessment Tax Assessment Total Assessment is a certain percentage of the fair market value that is determined by local assessors to be the total taxable value of land and additions on the property. | Land | Improvement |
|---|---|---|---|---|
| 2025 | $8,441 | $45,785 | $11,781 | $34,004 |
| 2024 | $8,453 | $43,424 | $11,490 | $31,934 |
| 2023 | $8,009 | $41,274 | $11,155 | $30,119 |
| 2022 | $7,118 | $53,640 | $17,400 | $36,240 |
| 2021 | $7,772 | $57,180 | $17,400 | $39,780 |
| 2020 | $7,780 | $60,060 | $17,400 | $42,660 |
| 2019 | $7,277 | $61,260 | $17,400 | $43,860 |
| 2018 | $6,714 | $34,395 | $12,920 | $21,475 |
| 2017 | $6,346 | $32,602 | $13,041 | $19,561 |
| 2016 | $6,077 | $32,602 | $13,041 | $19,561 |
| 2015 | $3,490 | $31,795 | $14,773 | $17,022 |
| 2014 | $3,490 | $30,156 | $15,196 | $14,960 |
Source: Public Records
Map
Nearby Homes
- 93-09 43rd Ave
- 91-23 Corona Ave Unit 6B
- 91-23 Corona Ave Unit 5E
- 91-23 Corona Ave Unit 6C
- 91-23 Corona Ave Unit 4A
- 91-23 Corona Ave Unit 2F
- 94-44 45th Ave
- 92-29 Lamont Ave Unit 2K
- 92-29 Lamont Ave Unit 2
- 91-16 43rd Ave
- 9461 43rd Ave
- 9318 Lamont Ave
- 94-68 45th Ave
- 91-08 43rd Ave
- 4239 Elbertson St
- 94-66 45th Ave
- 9465 44th Ave
- 94-14 Corona Ave
- 4131 95th St
- 41-41 Denman St
- 43-42 Elbertson St
- 4340 Elbertson St
- 4344 Elbertson St
- 4338 Elbertson St
- 43-38 Elbertson St
- 4350 Elbertson St
- 93-15 43rd Ave
- 9311 43rd Ave
- 9315 43rd Ave
- 4334 Elbertson St
- 9309 43rd Ave
- 4332 Elbertson St
- 4352 Elbertson St
- 9307 43rd Ave
- 43-32 Elbertson St
- 9305 43rd Ave
- 4330 Elbertson St
- 4343 Elbertson St
- 4349 Elbertson St
- 4347 Elbertson St