Estimated Value: $216,730 - $244,000
3
Beds
2
Baths
1,109
Sq Ft
$205/Sq Ft
Est. Value
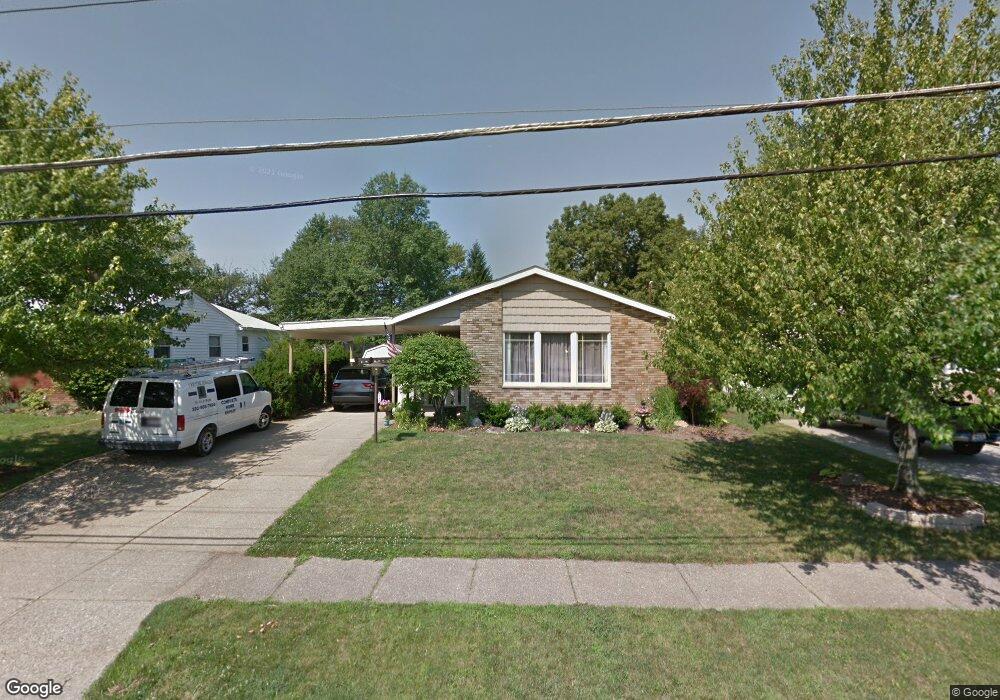
About This Home
This home is located at 4342 Maplepark Rd, Stow, OH 44224 and is currently estimated at $227,433, approximately $205 per square foot. 4342 Maplepark Rd is a home located in Summit County with nearby schools including Stow-Munroe Falls High School, Holy Family Elementary School, and Walsh Jesuit High School.
Ownership History
Date
Name
Owned For
Owner Type
Purchase Details
Closed on
Jul 19, 2016
Sold by
Setlock Robert J
Bought by
Setlock Robert and Mccauley Lynne
Current Estimated Value
Home Financials for this Owner
Home Financials are based on the most recent Mortgage that was taken out on this home.
Original Mortgage
$102,994
Outstanding Balance
$65,275
Interest Rate
3.8%
Mortgage Type
FHA
Estimated Equity
$162,158
Purchase Details
Closed on
Jun 18, 2008
Sold by
Kalman Robin S and Kalman Dolores J
Bought by
Setlock Robert J
Home Financials for this Owner
Home Financials are based on the most recent Mortgage that was taken out on this home.
Original Mortgage
$116,176
Interest Rate
6.05%
Mortgage Type
FHA
Create a Home Valuation Report for This Property
The Home Valuation Report is an in-depth analysis detailing your home's value as well as a comparison with similar homes in the area
Home Values in the Area
Average Home Value in this Area
Purchase History
| Date | Buyer | Sale Price | Title Company |
|---|---|---|---|
| Setlock Robert | -- | None Available | |
| Setlock Robert J | $118,000 | Abby Title |
Source: Public Records
Mortgage History
| Date | Status | Borrower | Loan Amount |
|---|---|---|---|
| Open | Setlock Robert | $102,994 | |
| Previous Owner | Setlock Robert J | $116,176 |
Source: Public Records
Tax History
| Year | Tax Paid | Tax Assessment Tax Assessment Total Assessment is a certain percentage of the fair market value that is determined by local assessors to be the total taxable value of land and additions on the property. | Land | Improvement |
|---|---|---|---|---|
| 2024 | $3,493 | $61,328 | $12,219 | $49,109 |
| 2023 | $3,493 | $61,328 | $12,219 | $49,109 |
| 2022 | $3,001 | $46,390 | $9,188 | $37,202 |
| 2021 | $2,691 | $46,390 | $9,188 | $37,202 |
| 2020 | $2,646 | $46,390 | $9,190 | $37,200 |
| 2019 | $2,353 | $38,420 | $9,190 | $29,230 |
| 2018 | $2,315 | $38,420 | $9,190 | $29,230 |
| 2017 | $2,232 | $38,420 | $9,190 | $29,230 |
| 2016 | $2,274 | $35,850 | $9,190 | $26,660 |
| 2015 | $2,232 | $35,990 | $9,190 | $26,800 |
| 2014 | $2,234 | $35,990 | $9,190 | $26,800 |
| 2013 | $2,326 | $37,780 | $9,190 | $28,590 |
Source: Public Records
Map
Nearby Homes
- 4287 Osage St
- 2344 Echo Valley Dr
- 2365 Norman Dr
- 4205 Osage St
- 4534 Foresthill Rd
- 4556 Fishcreek Rd
- 4544 Fishcreek Rd
- 4138 Genevieve Blvd
- 0 Pardee Rd
- 4040 Burton Dr
- 4003 Kenneth Rd
- 2072 White Oak Dr Unit 2076
- 2055-2059 Bryn Mawr Dr
- 2419 Liberty Rd
- 4424 Timberdale Dr Unit 4428
- 0 Vira Rd
- 3846 Charring Cross Dr
- 1961 Arndale Rd
- 1953 Arndale Rd
- 2908 Wexford Blvd
- 4350 Maplepark Rd
- 4336 Maplepark Rd
- 4356 Maplepark Rd
- 4328 Maplepark Rd
- 2417 Elizabeth Dr
- 4337 Maplepark Rd
- 4299 N Gilwood Dr
- 2427 Elizabeth Dr
- 4443 N Norman Dr
- 4362 Maplepark Rd
- 4305 N Gilwood Dr
- 4440 N Norman Dr
- 4287 N Gilwood Dr
- 2409 Elizabeth Dr
- 4363 Maplepark Rd
- 4325 Maplepark Rd
- 4311 N Gilwood Dr
- 4368 Maplepark Rd
- 2397 Elizabeth Dr
- 4426 N Norman Dr Unit 4430
Your Personal Tour Guide
Ask me questions while you tour the home.