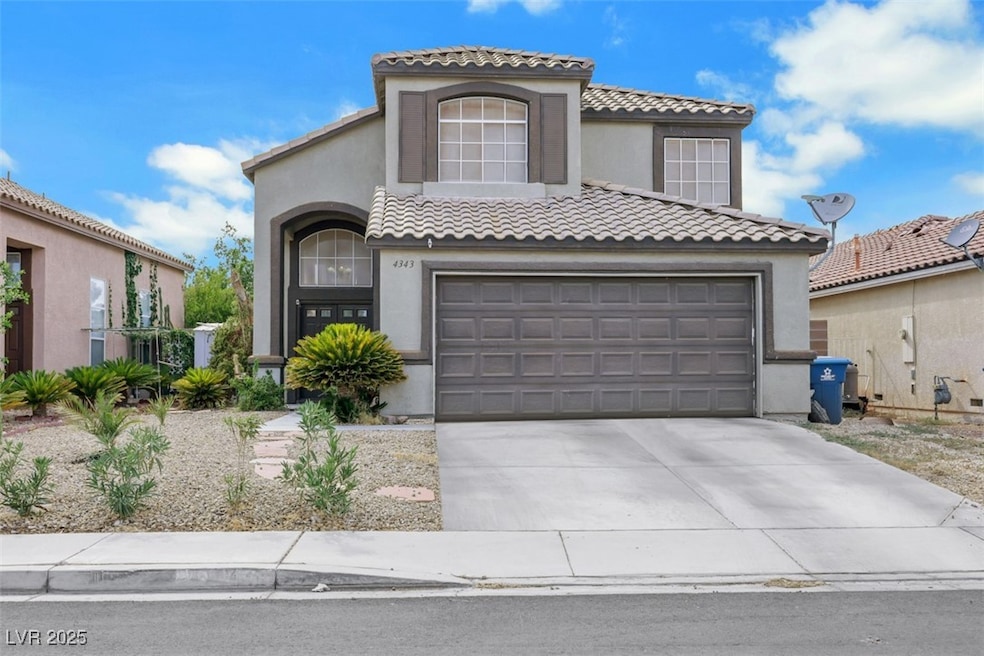
4343 Chessman Way Las Vegas, NV 89147
Estimated payment $2,550/month
Highlights
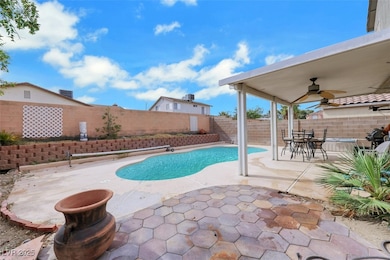
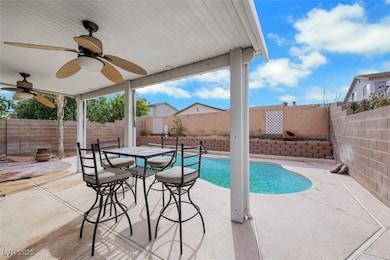
- Fiberglass Pool
- Fireplace in Kitchen
- Private Yard
- Mountain View
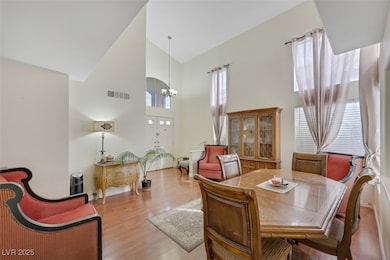
- Vaulted Ceiling
- No HOA
About This Home
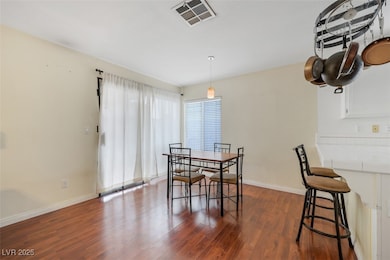
This 3-bedroom, 3-bath home with a pool offers a spacious floor plan with vaulted ceilings and a covered deck/porch perfect for outdoor living. No HOA and conveniently located near schools, shopping, dining, and just minutes from The Strip. Desert landscaping provides easy maintenance. Whether you’re looking to do your own upgrades, rent, or flip, this property is a versatile opportunity. Seller is motivated—schedule your showing today and bring your best offer! Look out for the upcoming open house. Great for investors!
Listing Agent
King Realty Group Brokerage Phone: (209) 518-6536 License #S.0185021 Listed on: 09/25/2025
Home Details
Home Type
- Single Family
Est. Annual Taxes
- $2,151
Year Built
- Built in 1995
Lot Details
- 4,792 Sq Ft Lot
- East Facing Home
- Property is Fully Fenced
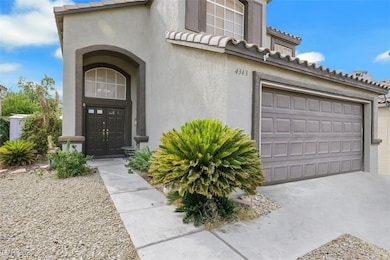
- Desert Landscape
- Private Yard
Parking
- 2 Car Attached Garage
- Guest Parking
- Open Parking
Home Design
- Frame Construction
- Tile Roof
- Stucco
Interior Spaces
- 1,749 Sq Ft Home
- 2-Story Property
- Furnished or left unfurnished upon request
- Vaulted Ceiling
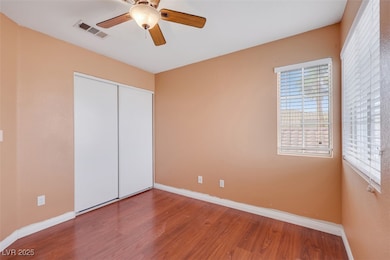
- Ceiling Fan
- Gas Fireplace
- Blinds
- Drapes & Rods
- Family Room with Fireplace
- Mountain Views
Kitchen
- Built-In Gas Oven
- Gas Cooktop
- Disposal
- Fireplace in Kitchen
Flooring
- Carpet
- Linoleum
- Laminate
- Vinyl
Bedrooms and Bathrooms
- 4 Bedrooms
- 3 Full Bathrooms
Laundry
- Laundry on main level
- Dryer
- Washer
Outdoor Features
- Fiberglass Pool
- Patio
- Porch
Schools
- Diskin Elementary School
- Lawrence Middle School
- Spring Valley High School
Utilities
- Cooling System Powered By Gas
- Central Heating and Cooling System
- Heating System Uses Gas
- Water Heater
- Cable TV Available
Community Details
- No Home Owners Association
- Spring Valley Cottages #6B Subdivision
Map
Home Values in the Area
Average Home Value in this Area
Tax History
| Year | Tax Paid | Tax Assessment Tax Assessment Total Assessment is a certain percentage of the fair market value that is determined by local assessors to be the total taxable value of land and additions on the property. | Land | Improvement |
|---|---|---|---|---|
| 2025 | $2,151 | $104,187 | $37,450 | $66,737 |
| 2024 | $1,854 | $104,187 | $37,450 | $66,737 |
| 2023 | $1,854 | $96,820 | $33,600 | $63,220 |
| 2022 | $1,973 | $85,524 | $27,300 | $58,224 |
| 2021 | $3,101 | $78,570 | $23,100 | $55,470 |
| 2020 | $1,694 | $77,197 | $22,050 | $55,147 |
| 2019 | $1,587 | $74,780 | $20,300 | $54,480 |
| 2018 | $1,515 | $69,951 | $17,500 | $52,451 |
| 2017 | $2,037 | $69,444 | $16,100 | $53,344 |
| 2016 | $1,483 | $66,973 | $12,950 | $54,023 |
| 2015 | $1,415 | $58,220 | $9,100 | $49,120 |
| 2014 | $1,371 | $49,594 | $5,950 | $43,644 |
Property History
| Date | Event | Price | List to Sale | Price per Sq Ft |
|---|---|---|---|---|
| 10/27/2025 10/27/25 | Price Changed | $449,999 | -6.1% | $257 / Sq Ft |
| 09/25/2025 09/25/25 | For Sale | $479,000 | -- | $274 / Sq Ft |
Purchase History
| Date | Type | Sale Price | Title Company |
|---|---|---|---|
| Bargain Sale Deed | $245,000 | Nevada Title Las Vegas | |
| Interfamily Deed Transfer | -- | Lawyers Title Of Nevada | |
| Interfamily Deed Transfer | $84,000 | Equity Title | |
| Bargain Sale Deed | $168,000 | Equity Title | |
| Corporate Deed | $127,000 | United Title |
Mortgage History
| Date | Status | Loan Amount | Loan Type |
|---|---|---|---|
| Open | $240,562 | FHA | |
| Previous Owner | $210,000 | New Conventional | |
| Previous Owner | $134,400 | No Value Available | |
| Previous Owner | $112,900 | No Value Available | |
| Closed | $25,200 | No Value Available |
Source: Las Vegas REALTORS®
MLS Number: 2719393
APN: 163-22-621-038
Disclaimer: Certain information contained herein is derived from information provided by parties other than Homes.com. All information provided is deemed reliable, but is not guaranteed to be accurate and should be independently verified.
![]() The data relating to real estate for sale on this web site comes in part from the INTERNET DATA EXCHANGE Program of the Greater Las Vegas Association of REALTORS® MLS. Real estate listings held by brokerage firms other than this site owner are marked with the IDX logo. Information is deemed reliable but not guaranteed. Copyright 2025 of the Greater Las Vegas Association of REALTORS® MLS. All rights reserved.
The data relating to real estate for sale on this web site comes in part from the INTERNET DATA EXCHANGE Program of the Greater Las Vegas Association of REALTORS® MLS. Real estate listings held by brokerage firms other than this site owner are marked with the IDX logo. Information is deemed reliable but not guaranteed. Copyright 2025 of the Greater Las Vegas Association of REALTORS® MLS. All rights reserved.
- 7324 Empress Dr
- 4419 Fairmont Cir
- 7229 Pinebrook Cir
- 7285 Pinebrook Cir
- 7247 Pleasant View Ave
- 7056 Sprucewood St
- 7231 Vireo Dr
- 7507 Mycroft Ct
- 7328 Coffeyville Ave
- 4322 Satinwood Dr Unit 9
- 4502 New Dupell Way
- 7225 Bridgeview Ave
- 4321 Satinwood Dr
- 7056 Hillcroft Way
- 4352 Bramblewood St
- 7400 W Flamingo Rd Unit 1033
- 7400 W Flamingo Rd Unit 2013
- 7400 W Flamingo Rd Unit 1087
- 7400 W Flamingo Rd Unit 2008
- 7075 Starwood Dr
- 7312 Empress Dr
- 4194 Greenpoint St
- 7301 Pleasant View Ave
- 7345 Vireo Dr
- 7112 Forest Vista St Unit 2
- 7078 Forest Vista St
- 7418 Coffeyville Ave
- 7400 W Flamingo Rd Unit 1050
- 7400 W Flamingo Rd Unit 1034
- 7400 W Flamingo Rd Unit 1056
- 7400 W Flamingo Rd Unit 2032
- 7400 W Flamingo Rd Unit 2022
- 7400 W Flamingo Rd Unit 2006
- 4398 Bramblewood St
- 4422 Bramblewood St
- 7216 Archcrest Ave
- 4067 Arrowood Dr
- 7289 Topeka Dr
- 7019 Grassy Knoll St
- 6969 Grassy Knoll St
