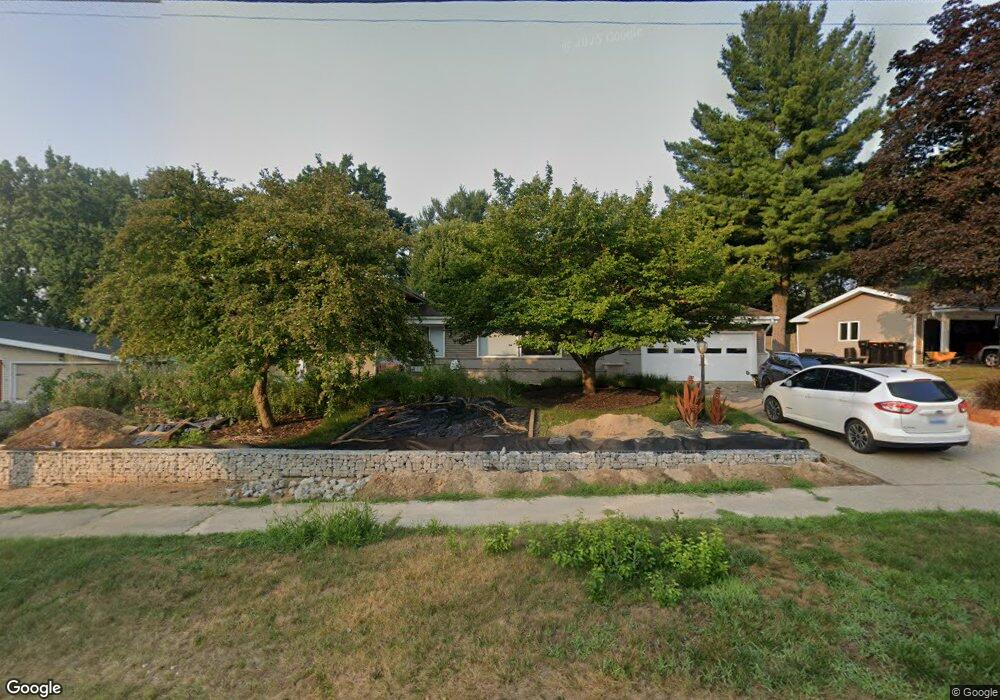
4344 Balfour Dr SE Grand Rapids, MI 49546
Forest Hills NeighborhoodEstimated Value: $416,206 - $476,000
3
Beds
3
Baths
1,949
Sq Ft
$225/Sq Ft
Est. Value
About This Home
This home is located at 4344 Balfour Dr SE, Grand Rapids, MI 49546 and is currently estimated at $438,302, approximately $224 per square foot. 4344 Balfour Dr SE is a home located in Kent County with nearby schools including Meadow Brook Elementary School, Northern Trails 5/6 School, and Northern Hills Middle School.
Ownership History
Date
Name
Owned For
Owner Type
Purchase Details
Closed on
Feb 8, 2024
Sold by
Williams Brent and Williams Kelsey
Bought by
Williams Family Trust and Williams
Current Estimated Value
Purchase Details
Closed on
Mar 27, 2019
Sold by
Dahlquist Kristine
Bought by
Dahlquist Kristine
Home Financials for this Owner
Home Financials are based on the most recent Mortgage that was taken out on this home.
Original Mortgage
$220,000
Interest Rate
4.3%
Mortgage Type
New Conventional
Purchase Details
Closed on
Dec 31, 2016
Sold by
Jasinki Larry J
Bought by
Jasinki Larry J and Dablquist Kristine
Purchase Details
Closed on
May 21, 2012
Sold by
Jasinksi Larry J and Jasinski Carmen L
Bought by
Jasinski Larry J and Jasinski Carmen L
Purchase Details
Closed on
Nov 26, 1997
Sold by
Sorensen Evelyn W
Bought by
Heidenga Gregory C and Jasinski Larry
Create a Home Valuation Report for This Property
The Home Valuation Report is an in-depth analysis detailing your home's value as well as a comparison with similar homes in the area
Home Values in the Area
Average Home Value in this Area
Purchase History
| Date | Buyer | Sale Price | Title Company |
|---|---|---|---|
| Williams Family Trust | -- | None Listed On Document | |
| Dahlquist Kristine | $275,000 | Chicago Title Of Mi Inc | |
| Jasinki Larry J | -- | None Available | |
| Jasinski Larry J | -- | None Available | |
| Heidenga Gregory C | $105,000 | -- |
Source: Public Records
Mortgage History
| Date | Status | Borrower | Loan Amount |
|---|---|---|---|
| Previous Owner | Dahlquist Kristine | $220,000 |
Source: Public Records
Tax History Compared to Growth
Tax History
| Year | Tax Paid | Tax Assessment Tax Assessment Total Assessment is a certain percentage of the fair market value that is determined by local assessors to be the total taxable value of land and additions on the property. | Land | Improvement |
|---|---|---|---|---|
| 2025 | $2,967 | $193,800 | $0 | $0 |
| 2024 | $2,967 | $175,500 | $0 | $0 |
| 2023 | $2,837 | $157,400 | $0 | $0 |
| 2022 | $3,821 | $138,700 | $0 | $0 |
| 2021 | $3,728 | $131,100 | $0 | $0 |
| 2020 | $2,649 | $124,000 | $0 | $0 |
| 2019 | $2,255 | $115,900 | $0 | $0 |
| 2018 | $2,218 | $101,200 | $0 | $0 |
| 2017 | $2,208 | $91,200 | $0 | $0 |
| 2016 | $2,129 | $87,100 | $0 | $0 |
| 2015 | -- | $87,100 | $0 | $0 |
| 2013 | -- | $67,500 | $0 | $0 |
Source: Public Records
Map
Nearby Homes
- 1150 Farnsworth Ave SE
- 4221 Edinburgh Dr SE
- 1027 Waltham Ave SE
- 4467 Orchard Creek Ct SE
- The Windsor Plan at Bonnie Meadows
- 4519 Thornberry Dr SE Unit 26
- 1145 Eastmont Dr SE
- 4327 Woodside Oaks Dr SE
- 4323 Woodside Oaks Dr SE
- 4694 E Meadows Dr SE
- 884 Orlando Ave SE
- 4365 Cloverleaf Dr SE Unit Lot 8
- 1618 Blue Grass Ct SE
- 4972 Luxemburg St SE Unit 8
- 3547 Lake Dr SE
- 1950 Hidden Oak Ct SE
- 3724 Windshire Dr SE
- 632 Cascade Hills Ridge SE
- 610 Cascade Hills Hollow SE
- 1840 Keyhill Ave SE
- 4344 Balfour St SE
- 4336 Balfour Dr SE
- 4336 Balfour St SE
- 4356 Balfour St SE
- 4345 Balfour St SE
- 4325 Castle Dr SE
- 1143 Farnsworth Ave SE
- 4328 Balfour St SE
- 4305 Castle Dr SE
- 4333 Balfour Dr SE
- 4333 Balfour St SE
- 1061 Farnsworth Ave SE
- 4325 Balfour St SE
- 1163 Farnsworth Ave SE
- 4316 Balfour St SE
- 4316 Balfour Dr SE
- 1120 Farnsworth Ave SE
- 1140 Farnsworth Ave SE
- 1053 Farnsworth Ave SE
- 1102 Farnsworth Ave SE