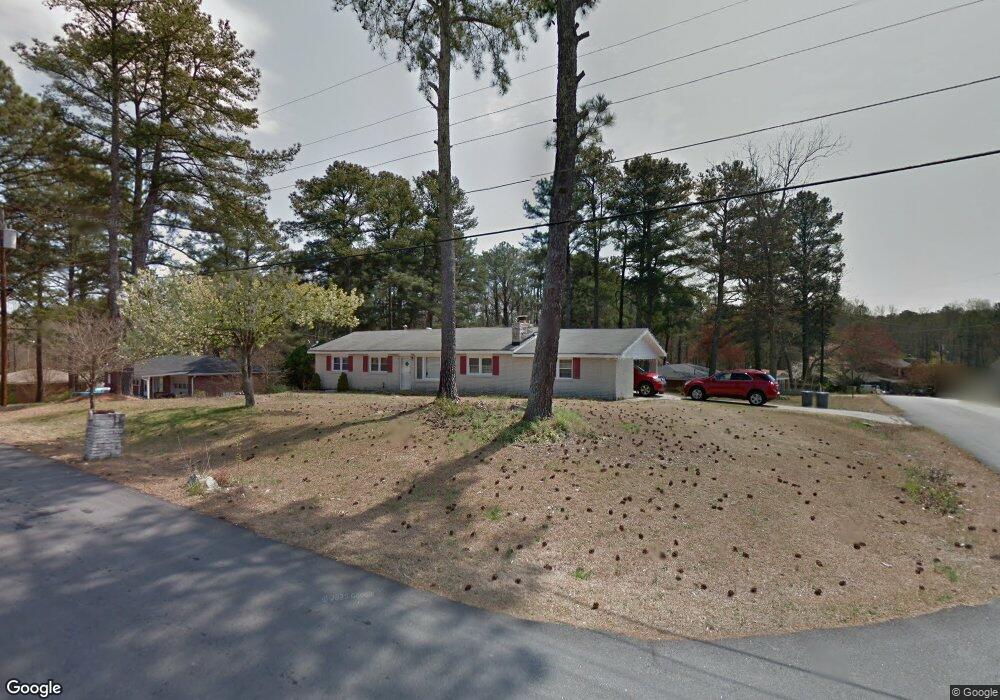
4344 Clare Ln Unit 1 Lithia Springs, GA 30122
Lithia Springs NeighborhoodEstimated Value: $237,000 - $272,000
3
Beds
1
Bath
1,378
Sq Ft
$185/Sq Ft
Est. Value
About This Home
This home is located at 4344 Clare Ln Unit 1, Lithia Springs, GA 30122 and is currently estimated at $254,915, approximately $184 per square foot. 4344 Clare Ln Unit 1 is a home located in Douglas County with nearby schools including Lithia Springs Elementary School, Turner Middle School, and Lithia Springs Comprehensive High School.
Ownership History
Date
Name
Owned For
Owner Type
Purchase Details
Closed on
Oct 21, 2013
Sold by
Ruiz-Alfaro Armando F
Bought by
Ruiz-Alfaro Armando F and Ruiz Jeanette
Current Estimated Value
Home Financials for this Owner
Home Financials are based on the most recent Mortgage that was taken out on this home.
Original Mortgage
$95,250
Outstanding Balance
$71,767
Interest Rate
4.57%
Mortgage Type
New Conventional
Estimated Equity
$183,148
Purchase Details
Closed on
Oct 7, 2004
Sold by
Falls Misty L and Falls Barbara
Bought by
Ruiz Fready
Home Financials for this Owner
Home Financials are based on the most recent Mortgage that was taken out on this home.
Original Mortgage
$99,750
Interest Rate
5.71%
Mortgage Type
New Conventional
Purchase Details
Closed on
Apr 2, 1997
Sold by
Wingo Kimberly Ann and Wingo James Gregory
Bought by
Falls Misty L Barbara
Purchase Details
Closed on
Sep 16, 1996
Sold by
Pierce James Julianne M
Bought by
Wingo James G Kimberly A
Create a Home Valuation Report for This Property
The Home Valuation Report is an in-depth analysis detailing your home's value as well as a comparison with similar homes in the area
Home Values in the Area
Average Home Value in this Area
Purchase History
| Date | Buyer | Sale Price | Title Company |
|---|---|---|---|
| Ruiz-Alfaro Armando F | -- | -- | |
| Ruiz Fready | $105,000 | -- | |
| Falls Misty L Barbara | $76,000 | -- | |
| Wingo James G Kimberly A | $67,000 | -- |
Source: Public Records
Mortgage History
| Date | Status | Borrower | Loan Amount |
|---|---|---|---|
| Open | Ruiz-Alfaro Armando F | $95,250 | |
| Previous Owner | Ruiz Fready | $99,750 | |
| Closed | Wingo James G Kimberly A | $0 |
Source: Public Records
Tax History Compared to Growth
Tax History
| Year | Tax Paid | Tax Assessment Tax Assessment Total Assessment is a certain percentage of the fair market value that is determined by local assessors to be the total taxable value of land and additions on the property. | Land | Improvement |
|---|---|---|---|---|
| 2024 | $2,412 | $103,400 | $19,600 | $83,800 |
| 2023 | $2,412 | $103,480 | $22,840 | $80,640 |
| 2022 | $1,858 | $71,720 | $15,520 | $56,200 |
| 2021 | $1,498 | $53,600 | $11,520 | $42,080 |
| 2020 | $1,528 | $53,600 | $11,520 | $42,080 |
| 2019 | $1,507 | $56,400 | $9,320 | $47,080 |
| 2018 | $1,338 | $47,920 | $8,120 | $39,800 |
| 2017 | $1,251 | $42,720 | $8,120 | $34,600 |
| 2016 | $1,181 | $39,920 | $7,800 | $32,120 |
| 2015 | $1,072 | $35,880 | $7,200 | $28,680 |
| 2014 | $1,075 | $35,360 | $7,600 | $27,760 |
| 2013 | -- | $35,240 | $7,600 | $27,640 |
Source: Public Records
Map
Nearby Homes
- 4365 Clare Ln
- 4319 Parkview Dr
- 4336 Parkview Dr
- 4485 Canary Ct
- 3916 S Martin Way
- 7146 Old Beulah Rd
- 540 Boulder Park Dr
- 6807 Tralee Dr
- 7163 Bluebird Ln
- 6776 Tralee Dr Unit 1
- 0 Mckown Rd Unit 7632191
- 0 Mckown Rd Unit 10583796
- 7144 Carolyn Cir
- 6906 Cherry Cir
- 11041 Veterans Memorial Hwy
- 4361 Ben Hill Rd
- 6600 N Beulah Rd
- 4332 Clare Ln Unit 1
- 4348 Donegal Cir Unit 80
- 4348 Donegal Cir
- 9 Old Beleauh Rd
- 4366 Clare Ln
- 4335 Clare Ln Unit 1
- 4355 Clare Ln
- 4314 Clare Ln
- 4355 Donegal Cir Unit 4355
- 4355 Donegal Cir
- 4352 Donegal Cir
- 4325 Clare Ln
- 4384 Clare Ln
- 4365 Donegal Cir
- 4364 Donegal Cir
- 4375 Clare Ln
- 4280 Clare Ln
- 4311 Clare Ln
- 4381 Clare Ln
- 4372 Donegal Cir