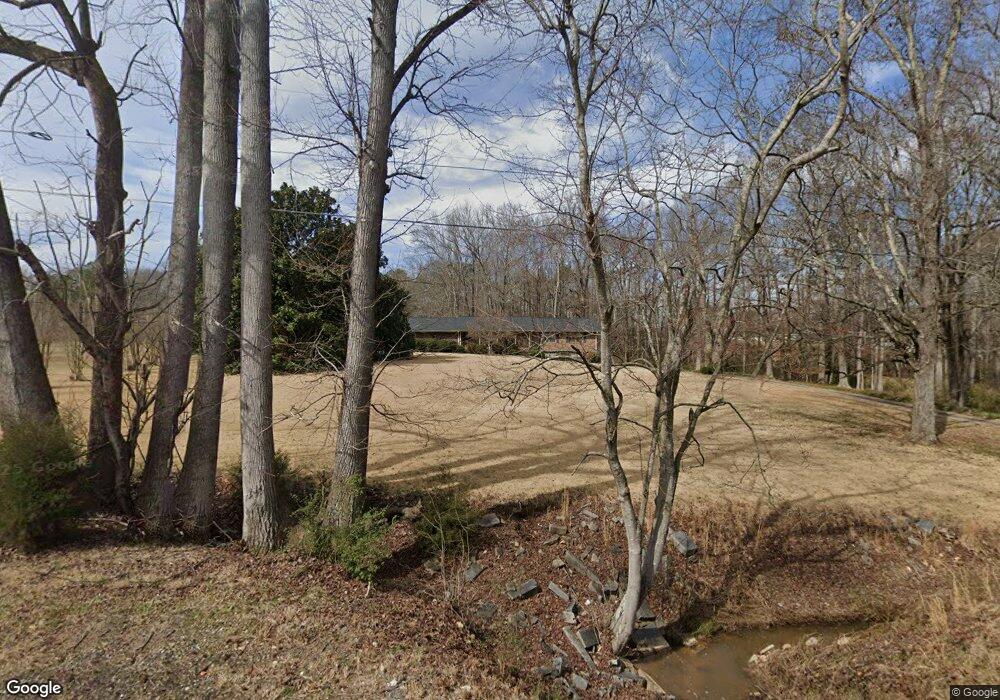
4344 Highway 29 S Colbert, GA 30628
Estimated Value: $239,000 - $409,529
Studio
2
Baths
3,049
Sq Ft
$114/Sq Ft
Est. Value
About This Home
This home is located at 4344 Highway 29 S, Colbert, GA 30628 and is currently estimated at $346,882, approximately $113 per square foot. 4344 Highway 29 S is a home located in Madison County with nearby schools including Madison County High School.
Ownership History
Date
Name
Owned For
Owner Type
Purchase Details
Closed on
Nov 9, 2017
Sold by
Austin Melissa Hawkins Sea
Bought by
Hardesty Rhonda and Hardesty Jonathon
Current Estimated Value
Home Financials for this Owner
Home Financials are based on the most recent Mortgage that was taken out on this home.
Original Mortgage
$176,382
Outstanding Balance
$146,978
Interest Rate
3.91%
Mortgage Type
New Conventional
Estimated Equity
$199,904
Purchase Details
Closed on
Nov 30, 2015
Sold by
Seagraves Donald W
Bought by
Seagraves Melissa H
Purchase Details
Closed on
Jul 21, 2006
Sold by
Seagraves Donald W
Bought by
Seagraves Donald W and Seagraves Melissa H
Purchase Details
Closed on
Jul 29, 1997
Sold by
Callaway Edna O
Bought by
Seagraves Donald W
Purchase Details
Closed on
Jan 1, 1980
Bought by
Callaway Edna O
Create a Home Valuation Report for This Property
The Home Valuation Report is an in-depth analysis detailing your home's value as well as a comparison with similar homes in the area
Purchase History
| Date | Buyer | Sale Price | Title Company |
|---|---|---|---|
| Hardesty Rhonda | $183,038 | -- | |
| Seagraves Melissa H | -- | -- | |
| Seagraves Donald W | -- | -- | |
| Seagraves Donald W | $140,000 | -- | |
| Callaway Edna O | -- | -- |
Source: Public Records
Mortgage History
| Date | Status | Borrower | Loan Amount |
|---|---|---|---|
| Open | Hardesty Rhonda | $176,382 |
Source: Public Records
Tax History
| Year | Tax Paid | Tax Assessment Tax Assessment Total Assessment is a certain percentage of the fair market value that is determined by local assessors to be the total taxable value of land and additions on the property. | Land | Improvement |
|---|---|---|---|---|
| 2025 | $2,757 | $110,495 | $39,582 | $70,913 |
| 2024 | $28 | $108,465 | $39,582 | $68,883 |
| 2023 | $2,985 | $97,788 | $32,985 | $64,803 |
| 2022 | $2,225 | $80,657 | $22,678 | $57,979 |
| 2021 | $1,961 | $64,226 | $22,678 | $41,548 |
| 2020 | $1,873 | $60,927 | $19,379 | $41,548 |
| 2019 | $1,869 | $60,099 | $19,379 | $40,720 |
| 2018 | $1,801 | $57,750 | $17,730 | $40,020 |
| 2017 | $1,686 | $58,554 | $16,492 | $42,062 |
| 2016 | $1,235 | $53,011 | $16,492 | $36,519 |
| 2015 | $1,233 | $53,011 | $16,492 | $36,519 |
| 2014 | $1,240 | $53,046 | $16,484 | $36,562 |
| 2013 | -- | $53,046 | $16,484 | $36,562 |
Source: Public Records
Map
Nearby Homes
- 1618 McCannon Morris Rd
- 975 Diamond Hill Neese Rd
- 120 Grace Ln Unit 6
- 176 Grace Ln Unit 5
- 1330 McCannon-morris Rd
- 1175 Diamond Hill Colbert Rd
- 0 Old Kincaid Rd Unit CL336310
- 0 Old Kincaid Rd Unit 10582354
- 142 Rolling Woods Ln Unit 29
- 142 Rolling Woods Ln
- 210 Joe Graham Rd
- 77 Sugar Maple Way Unit 44
- 45 Sugar Maple Way Unit 43
- 1625 Highway 29 S
- 162 Oak View Dr
- 1067 Garnett Ward Rd Unit 2
- 467 Diamond Hill Colbert Rd
- 1246 Stone Stewart Rd
- 0 Spratlin Mill Dr Unit LOT 14-C
- 103 Three Rivers Ct
- 4424 Highway 29 S
- 0 Highway 29 S Unit 8388474
- 0 Highway 29 S Unit CM909374
- 0 Highway 29 S Unit CM979936
- 0 Highway 29 S Unit 970157
- 0 Highway 29 S Unit 8932585
- 4200 Highway 29 S
- 4181 Highway 29 S
- 4154 Highway 29 S
- 4154 U S 29
- 4181 U S 29
- 124 Moons Grove Church Rd
- 4102 U S 29
- 4102 Highway 29 S
- 78 Moons Grove Church Rd
- 4084 Highway 29 S
- 4095 Highway 29 S
- 4105 Highway 29 S
- 4653 Highway 29 S
- 245 Moons Grove Church Rd
Your Personal Tour Guide
Ask me questions while you tour the home.