Estimated Value: $228,000 - $286,000
2
Beds
2
Baths
1,394
Sq Ft
$179/Sq Ft
Est. Value
About This Home
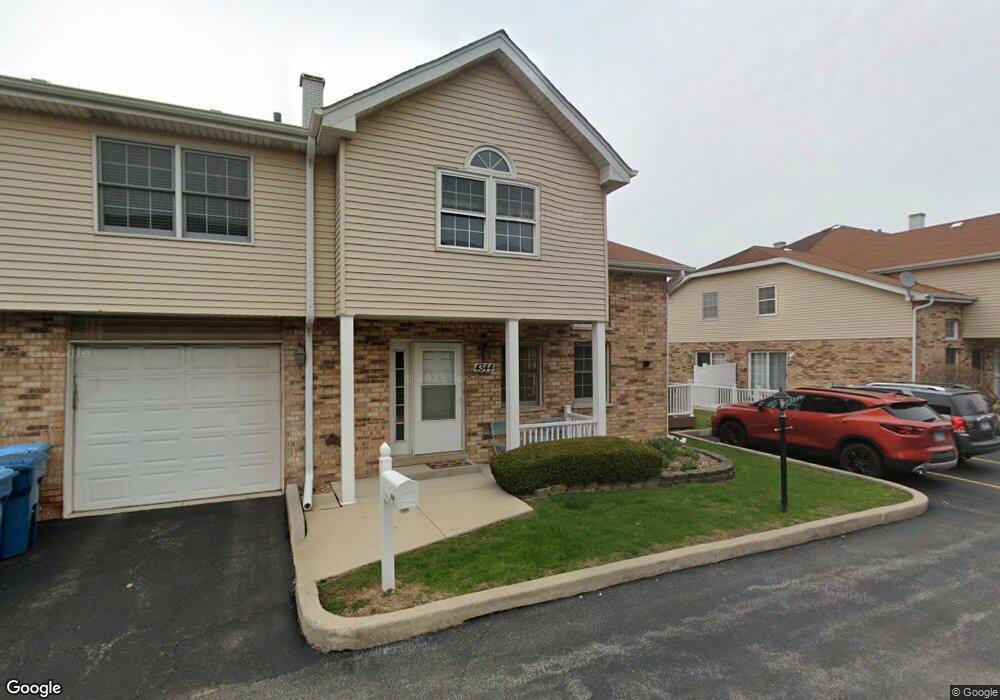
This home is located at 4344 W Emerald Way St, Alsip, IL 60803 and is currently estimated at $249,615, approximately $179 per square foot. 4344 W Emerald Way St is a home located in Cook County with nearby schools including Lane Elementary School, Prairie Jr High School, and A B Shepard High School.
Ownership History
Date
Name
Owned For
Owner Type
Purchase Details
Closed on
May 30, 2006
Sold by
Vande Werken Timothy J and Vande Werken Jennifer L
Bought by
Raney Curtis A and Carlyle Shelby K
Current Estimated Value
Home Financials for this Owner
Home Financials are based on the most recent Mortgage that was taken out on this home.
Original Mortgage
$194,500
Outstanding Balance
$119,387
Interest Rate
7.37%
Mortgage Type
Unknown
Estimated Equity
$130,228
Purchase Details
Closed on
Jun 20, 2003
Sold by
Moran David B
Bought by
Vandewerken Timothy J and Vandewerken Jennifer L
Home Financials for this Owner
Home Financials are based on the most recent Mortgage that was taken out on this home.
Original Mortgage
$110,000
Interest Rate
4.5%
Mortgage Type
Unknown
Purchase Details
Closed on
Apr 13, 1995
Sold by
State Bank Of Countryside
Bought by
Moran David B
Home Financials for this Owner
Home Financials are based on the most recent Mortgage that was taken out on this home.
Original Mortgage
$103,500
Interest Rate
8.64%
Create a Home Valuation Report for This Property
The Home Valuation Report is an in-depth analysis detailing your home's value as well as a comparison with similar homes in the area
Home Values in the Area
Average Home Value in this Area
Purchase History
| Date | Buyer | Sale Price | Title Company |
|---|---|---|---|
| Raney Curtis A | $194,500 | Cti | |
| Vandewerken Timothy J | $143,000 | Ctic | |
| Moran David B | $110,000 | -- |
Source: Public Records
Mortgage History
| Date | Status | Borrower | Loan Amount |
|---|---|---|---|
| Open | Raney Curtis A | $194,500 | |
| Previous Owner | Vandewerken Timothy J | $110,000 | |
| Previous Owner | Moran David B | $103,500 |
Source: Public Records
Tax History Compared to Growth
Tax History
| Year | Tax Paid | Tax Assessment Tax Assessment Total Assessment is a certain percentage of the fair market value that is determined by local assessors to be the total taxable value of land and additions on the property. | Land | Improvement |
|---|---|---|---|---|
| 2024 | $5,197 | $19,000 | $695 | $18,305 |
| 2023 | $4,589 | $19,000 | $695 | $18,305 |
| 2022 | $4,589 | $14,847 | $600 | $14,247 |
| 2021 | $4,400 | $14,847 | $600 | $14,247 |
| 2020 | $4,435 | $14,847 | $600 | $14,247 |
| 2019 | $5,317 | $17,003 | $537 | $16,466 |
| 2018 | $5,116 | $17,003 | $537 | $16,466 |
| 2017 | $5,176 | $17,003 | $537 | $16,466 |
| 2016 | $4,992 | $15,374 | $442 | $14,932 |
| 2015 | $4,904 | $15,374 | $442 | $14,932 |
| 2014 | $4,755 | $15,374 | $442 | $14,932 |
| 2013 | $5,573 | $18,861 | $442 | $18,419 |
Source: Public Records
Map
Nearby Homes
- 4343 W Emerald Way St
- 4336 W Emerald Way St
- 4326 W Emerald Way St
- 4406 W 127th Place
- 4309 W Park Lane Dr Unit 2B
- 12736 S Kenneth Ave Unit 1A
- 12738 S Kenneth Ave Unit E
- 12507 S Tripp Ave
- 12824 S Kenneth Ave Unit F1
- 4654 W 131st St Unit 1S
- 3909 W 123rd St Unit 205A
- 4804 W 118th St
- 4808 W 118th St
- 12026 S Kildare Ave Unit 16
- 4735 W 122nd St
- 3823 W 123rd St Unit 302
- 3821 W 123rd St Unit 301
- 3729 W Glen Dr Unit 804
- 12211 S Harding Ave
- 12147 S Cicero Ave
- 4350 W Emerald Way St
- 4349 W Emerald Way St
- 4338 W Emerald Way St
- 4337 W Emerald Way St
- 12639 S Kostner Ave Unit 3C
- 12639 S Kostner Ave Unit 1C
- 12639 S Kostner Ave Unit 1D
- 12639 S Kostner Ave Unit 2D
- 12639 S Kostner Ave Unit 3D
- 12639 S Kostner Ave Unit 2C
- 4342 W Emerald Way St
- 4332 W Emerald Way St
- 4331 W Emerald Way St
- 4348 W Emerald Way St
- 12635 S Kostner Ave Unit 2F
- 12635 S Kostner Ave Unit 2E
- 12635 S Kostner Ave Unit 1F
- 12635 S Kostner Ave Unit 1E
- 12643 S Kostner Ave Unit 1B
- 12643 S Kostner Ave Unit 3A